We use essential cookies to make Venngage work. By clicking “Accept All Cookies”, you agree to the storing of cookies on your device to enhance site navigation, analyze site usage, and assist in our marketing efforts.

Manage Cookies

Cookies and similar technologies collect certain information about how you’re using our website. Some of them are essential, and without them you wouldn’t be able to use Venngage. But others are optional, and you get to choose whether we use them or not.

Strictly Necessary Cookies

Always Active

These cookies are always on, as they’re essential for making Venngage work, and making it safe. Without these cookies, services you’ve asked for can’t be provided.

Show cookie providers

  • Venngage
  • Amazon
  • Google Login
  • Intercom

Functionality Cookies

These cookies help us provide enhanced functionality and personalisation, and remember your settings. They may be set by us or by third party providers.

Show cookie providers

  • Venngage
  • Chameleon
  • Intercom
  • Algolia

Performance Cookies

These cookies help us analyze how many people are using Venngage, where they come from and how they're using it. If you opt out of these cookies, we can’t get feedback to make Venngage better for you and all our users.

Show cookie providers

  • Venngage
  • Mixpanel
  • Intercom
  • Google Analytics
  • Hotjar

Targeting Cookies

These cookies are set by our advertising partners to track your activity and show you relevant Venngage ads on other sites as you browse the internet.

Show cookie providers

  • Google Ads
  • Google Tag Manager
  • Facebook
  • Pinterest
  • Product

  • Solutions

  • Templates

  • Learn

  • Pricing

Learn
Educational Resources
Blog
Webinars
Help Center

Venngage Line Graph Maker

Visualize a variety of data values in reports, presentations, and infographics with a line graph from Venngage's Line Graph Maker.

Venngage Line Graph Maker

With Venngage's easy-to-use line graph creator, anyone can make engaging line charts. It doesn't matter if you have a handful or hundreds of data values, our intuitive chart editor can handle it. 40,000+ businesses trust Venngage's chart templates.

Trusted by

See all templates

How to turn time-series data into an effective line chart:

How to turn time-series data into an effective line chart:

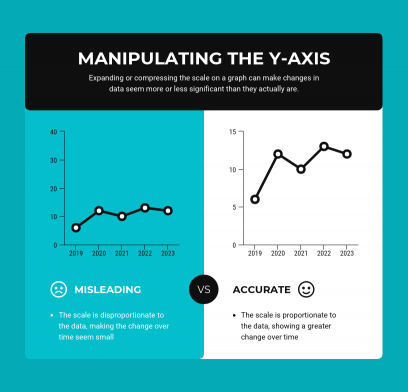
Line graphs are one of the most common data visualizations allowing readers to make quick comparisons to draw conclusions. With Venngage's templates, you can make charts in seconds.

How to turn time-series data into an effective line chart:

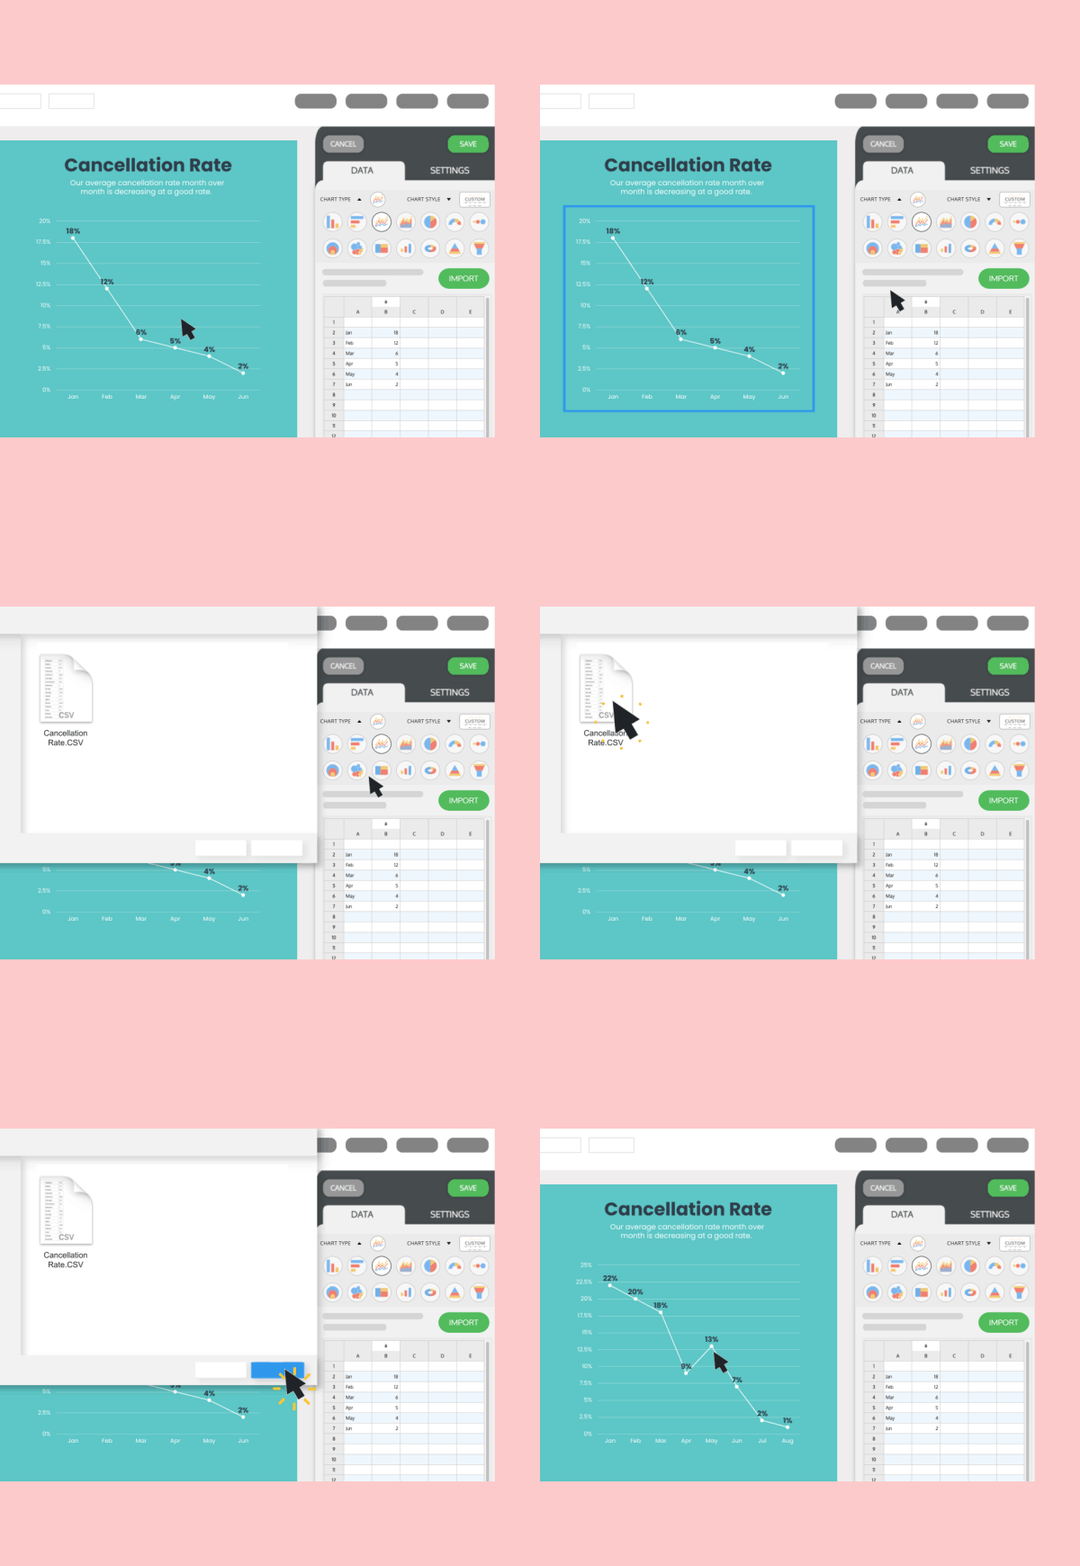
The Venngage Line Graph Maker makes it easy to visualize time-series data values. Import your data from a Google sheet, CSV, or XLSX file and the editor populates the y-axis and x-axis automatically.

How to turn time-series data into an effective line chart:

You can add different chart types to the same report with the Venngage line chart maker to visualize all kinds of business data. Then download the report as a PNG or PDF file once you're done.

How to turn time-series data into an effective line chart:

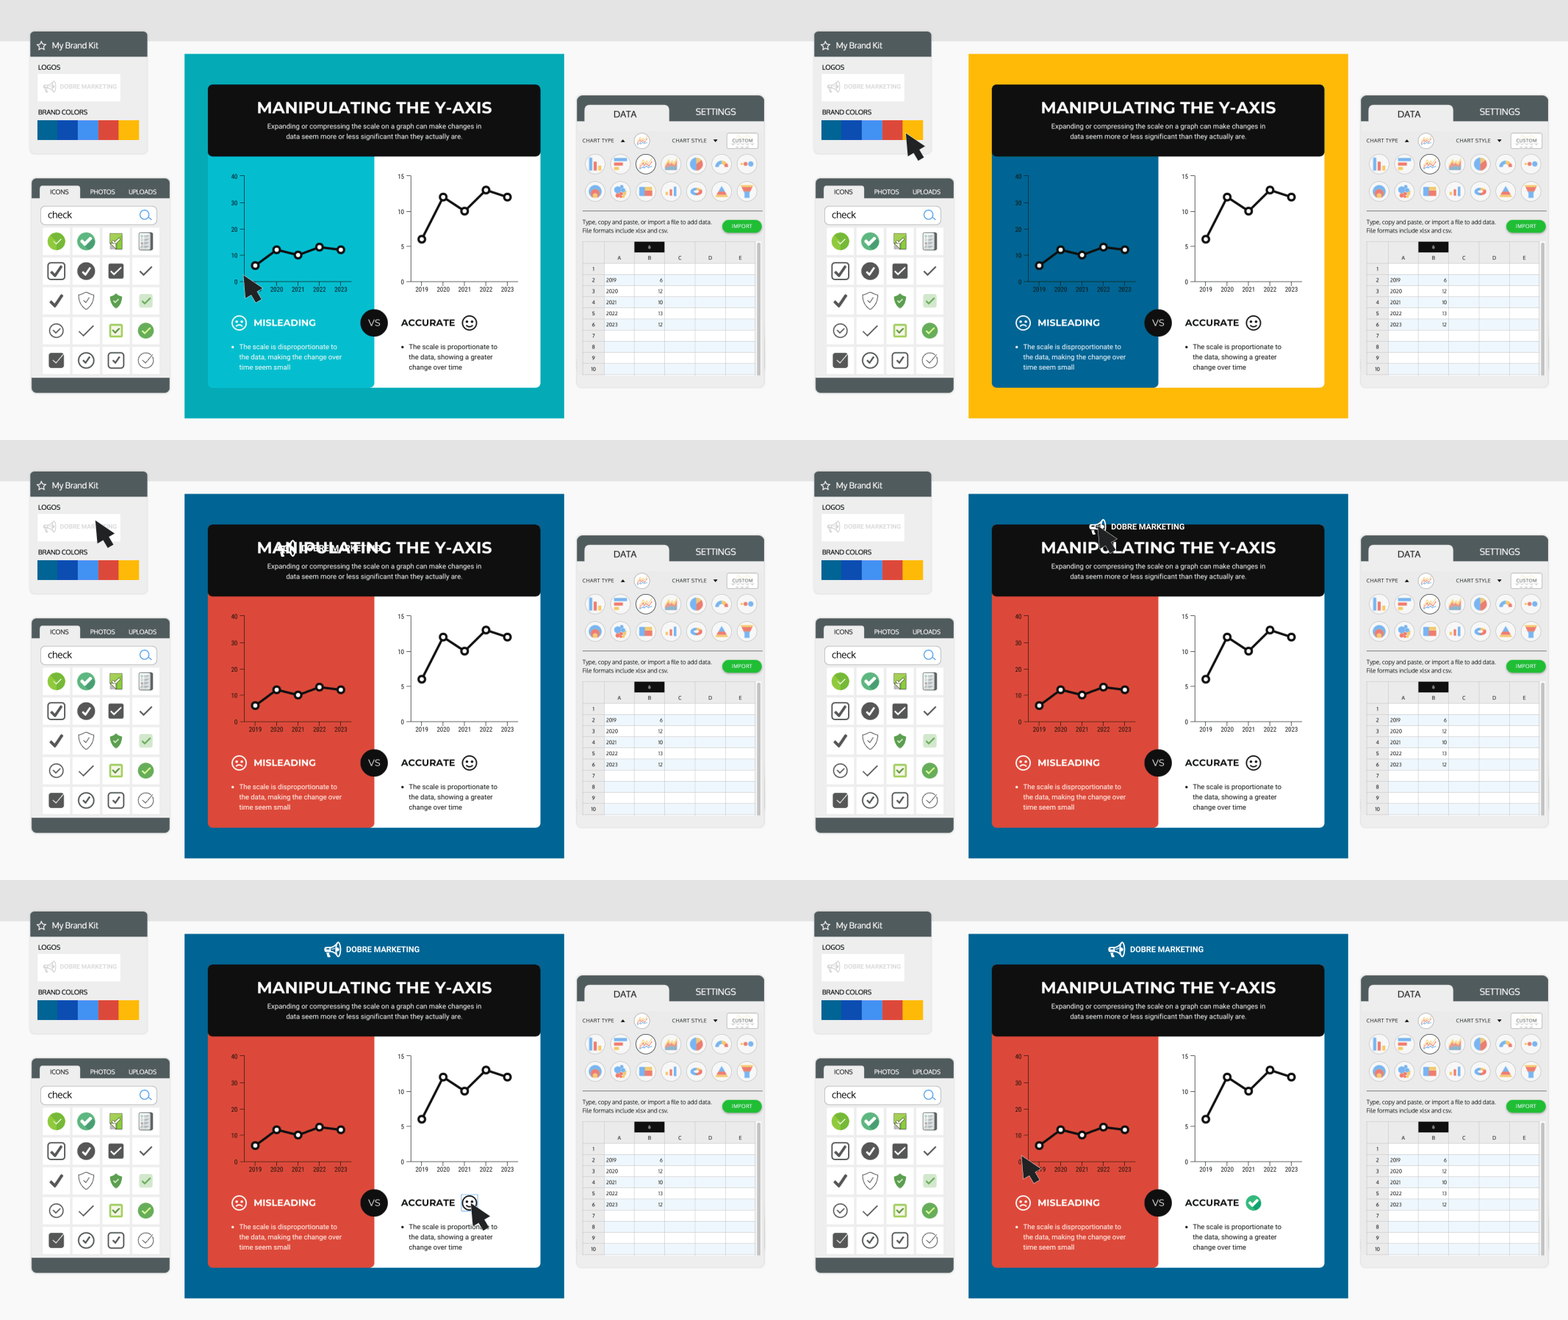
Make your charts and graphs your own by adding your branding elements to your designs. Our My Brand Kit feature imports your brand and does the branding work for you.

Make informative line charts with Venngage in just 5 steps:

1
Pick the perfect free line graph template from our collection of data visualizations.
2
Sign up for the online line graph maker with an email, Google, or Facebook account.
3
Add your data directly to our Line Graph Maker or import data from a Google Sheet, CSV, or XLSX file. The line graph will automatically update.
4
Now it's time to upgrade your line graph with some new colors, fonts, icons or other embellishments.
5
Download your line graph as a PNG or a PDF file (paid plans only). You can easily share a private link directly from the Line Graph Maker (free).
Make informative line charts with Venngage in just 5 steps:

Why Venngage's Line Graph Maker is the perfect data visualization solution:

Line Graph Templates

Line Graph Templates

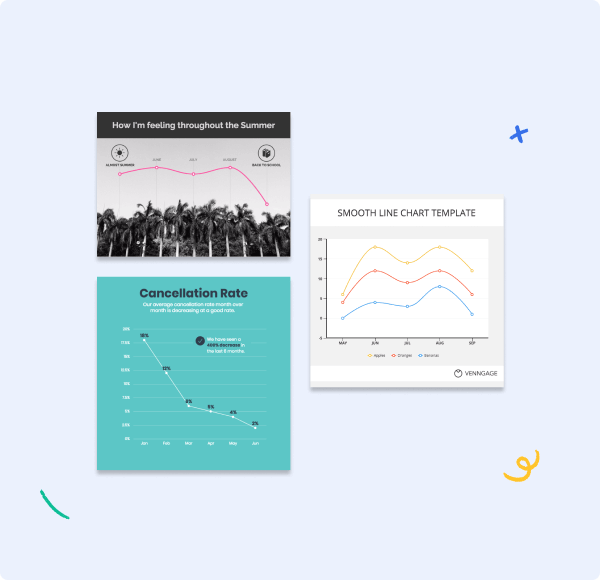
Make your data more accessible with professionally-made templates from our data visualization experts. Line graph creation is easy when our templates do all the work for you.

Drag-and-Drop Editor

Drag-and-Drop Editor

Make your line graph stand out. Change data labels, add values to the y-axis or x-axis of your chart, or include a graphic or two using our intuitive editor.

Export Line Graphs

Export Line Graphs

Share your line graph with your team, or on social media using a private sharing link. With a paid plan, you can export your line graph as a PNG, a PDF, or an interactive PDF.

Import Your Data

Import Your Data

With the Venngage line chart maker, import data directly from a Google Sheet, Excel CSV, or XLSX file, and the chart will display the data values automatically.

Brand Your Graph

Brand Your Graph

Add your branding to each line graph template with Venngage's My Brand Kit tool. Add your website, and the feature will import your logos, colors, and fonts.

Line Graph Shapes

Line Graph Shapes

Bring attention to important data points with our collection of icons, arrows, and shapes. You can easily highlight the story behind your numbers and values on your line graph.

START NOW
Line graph templates to display a variety of data types

Line graph templates to display a variety of data types

Save yourself some design time by using one of our many line graph templates. Our designers have already done all of the complicated design work, so you can start creating right now.

Instead of designing a line graph from scratch, you can import your data to our line graph templates, and move on with your day.

All you have to do is change the axis label and colors, or add a graphic to make your chart design stand out.

Add your brand colors, logos, and more to any line graph template with the innovative My Brand Kit feature. With a single click, any line graph can be updated to feature your brand colors, logos, and fonts.

Directly import your data into the Line Graph Maker

If you are working with a small data set you can quickly copy and paste your data directly into the Line Graph Maker. But when you start working with larger data sets, that approach doesn't work as well.

Our user-friendly editor makes it easy to add any sized data set to our charts. Upload a Google Sheet, CSV, or XLSX file, and your data will get added to the template.

Additionally, the data on your line graph will automatically be updated once you upload your files. All you have to do is make your values look good.
Directly import your data into the Line Graph Maker
Collaborate with your team to create better charts and graphs

Collaborate with your team to create better charts and graphs

You can make a good report, presentation, or infographic on your own. But to make reports that are impactful and actionable, you need some help. Specifically, your team's help.

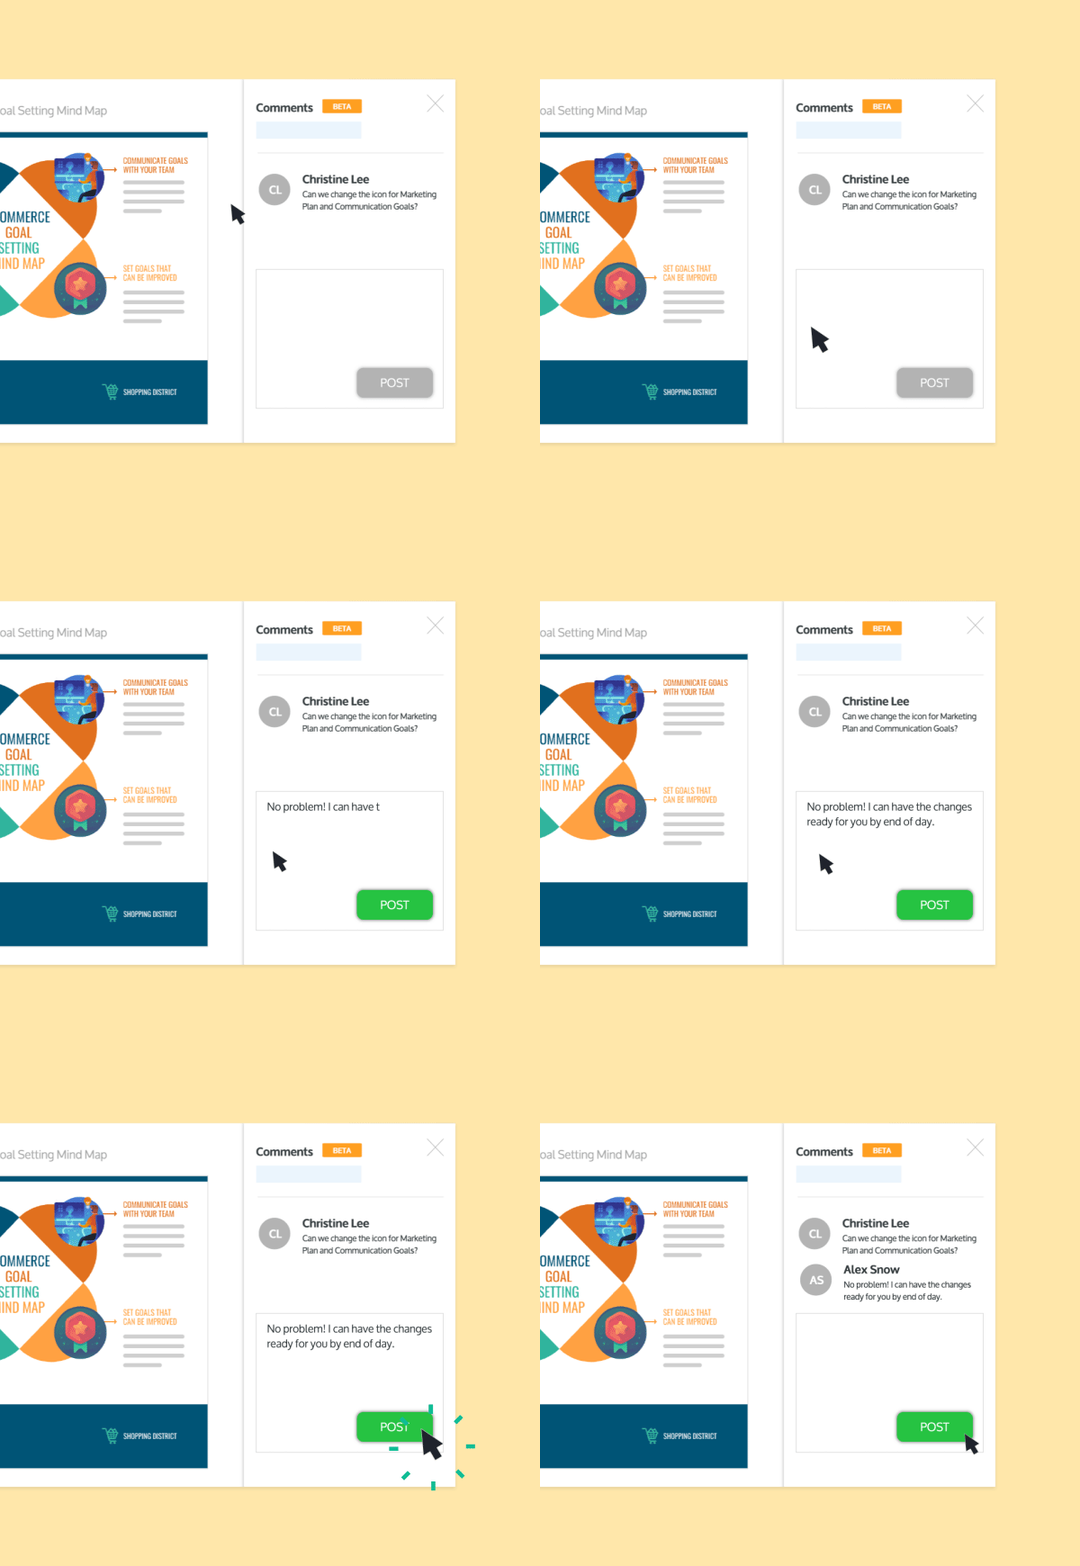
Venngage's online line graph creator includes the real-time collaboration feature where teams can work together to create better charts and graphs for reporting.

Invite team members and work concurrently on your line chart. Add comments for teams to follow or share instant feedback.

Creating reports has never been more collaborative.

24/7 chat and customer support

Don't worry if you get stuck while working on a line graph or have questions about using the Line Graph Maker. Our support team can help.

They are available 24/7 and will respond to literally any question you may have while you're creating your charts and graphs.

Plus, our blog and YouTube channel are full of tips that can help even the most novice designer create an amazing line graph.
24/7 chat and customer support

Line Graph Maker FAQs

How do I download a Venngage Line Graph?

You can download your line graph from the Line Graph Maker in a variety of formats, including PNG, PDF, or an interactive PDF file.

How much does Venngage cost?

Anyone can start creating a line graph for free and share it with the world using a private link. But there are some higher-level data visualization features that are only included in our Premium ($19/month) and Business ($49/month) subscriptions that aren't available to everyone.

What type of graph templates does Venngage have?

We have a vast collection of well-designed graph templates that our professional designers are always adding to. Plus, we have different types of infographics, charts, diagrams, reports, presentations, and social media graphics.

Not a designer? No problem! Anyone can create a line graph with the Venngage Line Graph Maker.

START NOW

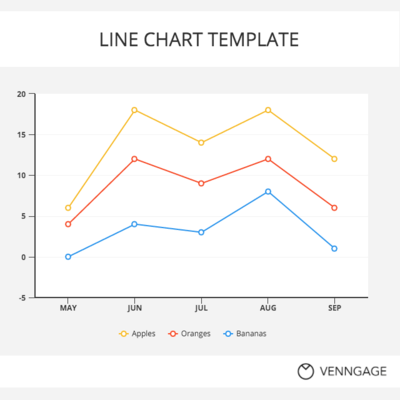
Start with one of our popular line graph examples
START NOW