How many presentations have you seen where the presenter tried to cram as much information into each slide as possible?
How about presentations where the presenter shares a bunch of numbers and statistics, without any visuals to help you understand them?
If you’re here, it’s probably because you want to make a presentation that does the opposite. You want to create an engaging presentation that uses visuals like infographics, charts, and diagrams to communicate your points effectively.
The question is: which presentation design tool is the best one to help you achieve that?
No doubt you’ve heard of Microsoft PowerPoint. For many workplaces and schools, it’s the default presentation tool offered. But is PowerPoint the best option for creating a data-driven presentation?
In this guide, we’ll offer you a comparison of Venngage and PowerPoint’s infographic design features, templates, and resources to help you determine which platform is the best for creating infographic presentations.
Table of Contents
- Who is PowerPoint built for?
- Who is Venngage built for?
- Getting started
- Picking a template
- Infographic presentation templates: PowerPoint vs. Venngage
- Editing an infographic presentation
- Adding your branding
- Support and resources
- Ease of use
Who is PowerPoint built for?
PowerPoint is Microsoft’s presentation design tool, offered as part of their Microsoft Office software suite. Because Microsoft Office caters to a general audience, PowerPoint’s features are also geared towards general use. People will typically choose to use PowerPoint because it integrates with Microsoft’s other programs.
While PowerPoint does offer some infographic templates, their selection is limited. They offer a much wider selection of standard presentation templates.
Who is Venngage built for?
Venngage is an easy-to-use design solution built for people who need to communicate complex and dry information engagingly.
People use Venngage most often for infographics, flowcharts, roadmaps, timelines, presentations, visual reports, posters, checklists, and more.
For example, project managers use Venngage to create project plan presentations, team leads and HR professionals use Venngage to create training presentations, and marketers use Venngage to create presentations sharing market research and campaign results.
If you’re looking to create any type of data-driven document, Venngage offers a wide variety of templates, focusing on business use cases.
Venngage also offers templates in a variety of design styles, all of which are fully customizable. We’ll go into that in more detail further down.
Related: 15 Best Infographic Tools, According to the Original Infographic Experts
Getting started: Venngage vs Powerpoint
To access PowerPoint, you will need to create a Microsoft Office 365 account. Once you create your account, you will be prompted to upgrade to a Microsoft Office 365 premium account. You can still use PowerPoint with a free account but you will only be able to access it in your browser.
You will also have the option to use PowerPoint’s web app or to download their desktop app. In order to use all of their features, you will need to download the app.
Once you’re in, you have the option to pick a blank template or one of PowerPoint’s pre-made templates.

Select a template and you’re in.
If you’re new to PowerPoint or you haven’t used it much, you won’t get much guidance from their editor. Instead, you will have to search for tutorials yourself on Microsoft’s website.
Getting started with Venngage
Venngage’s onboarding experience offers a much more tailored experience.
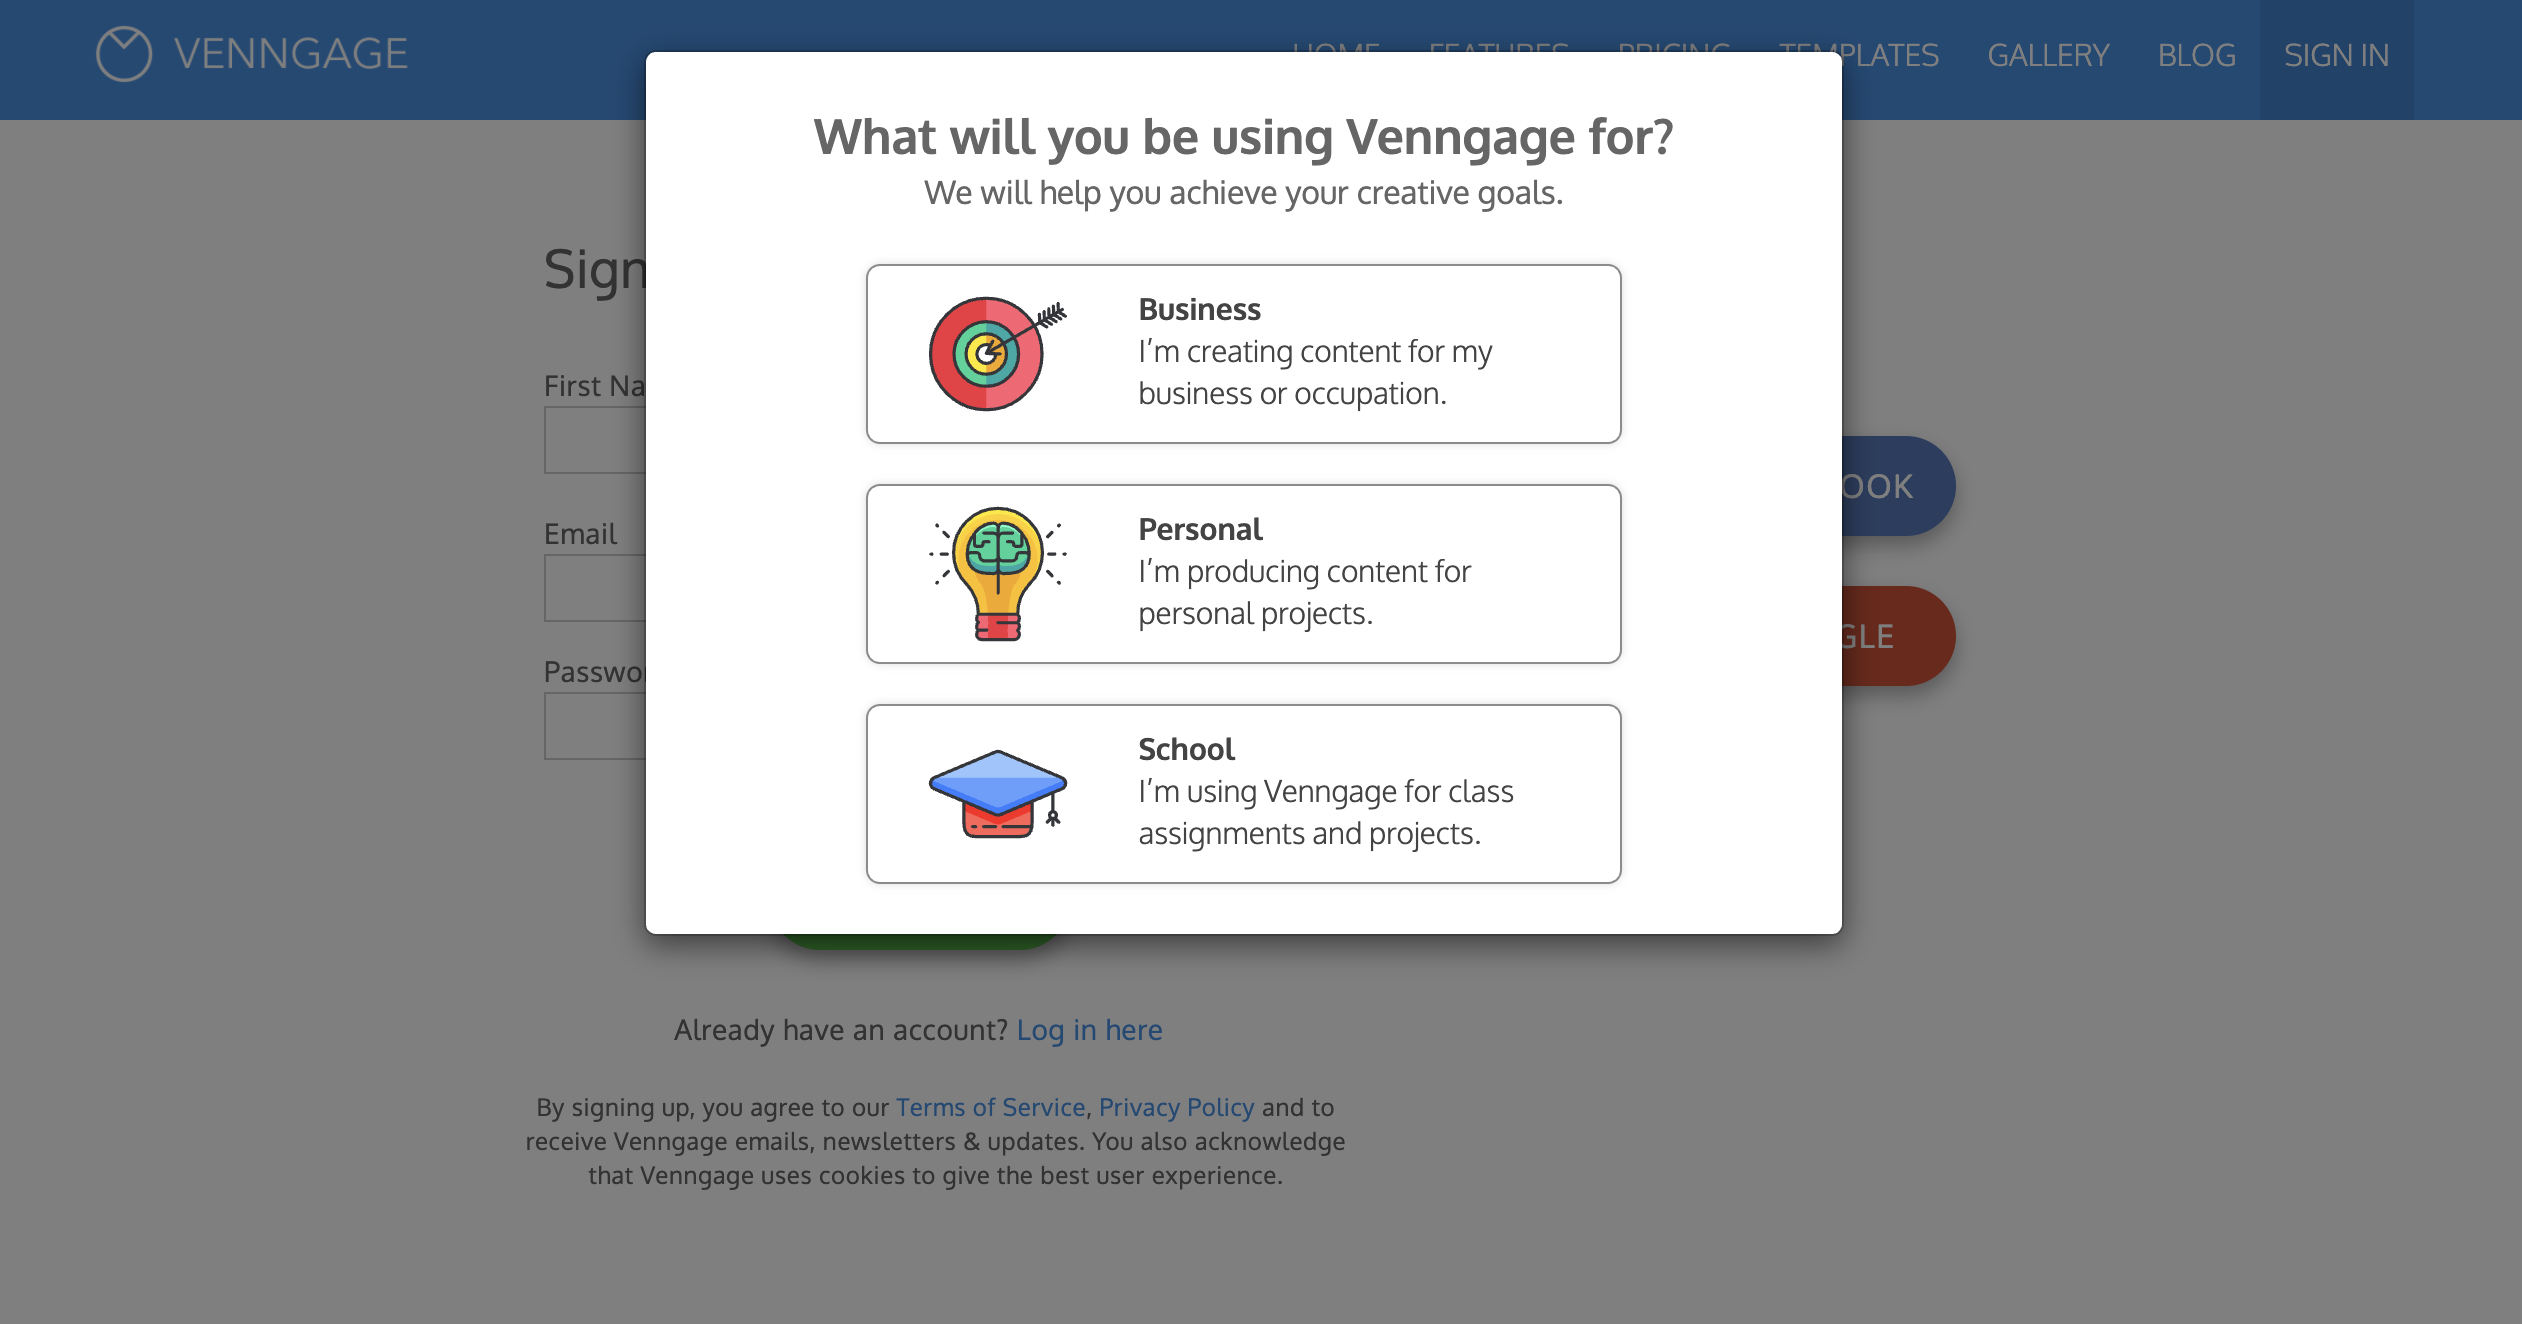
When you create an account, Venngage prompts you to identify your purpose for creating infographics first. This helps Venngage to curate templates based on your needs.
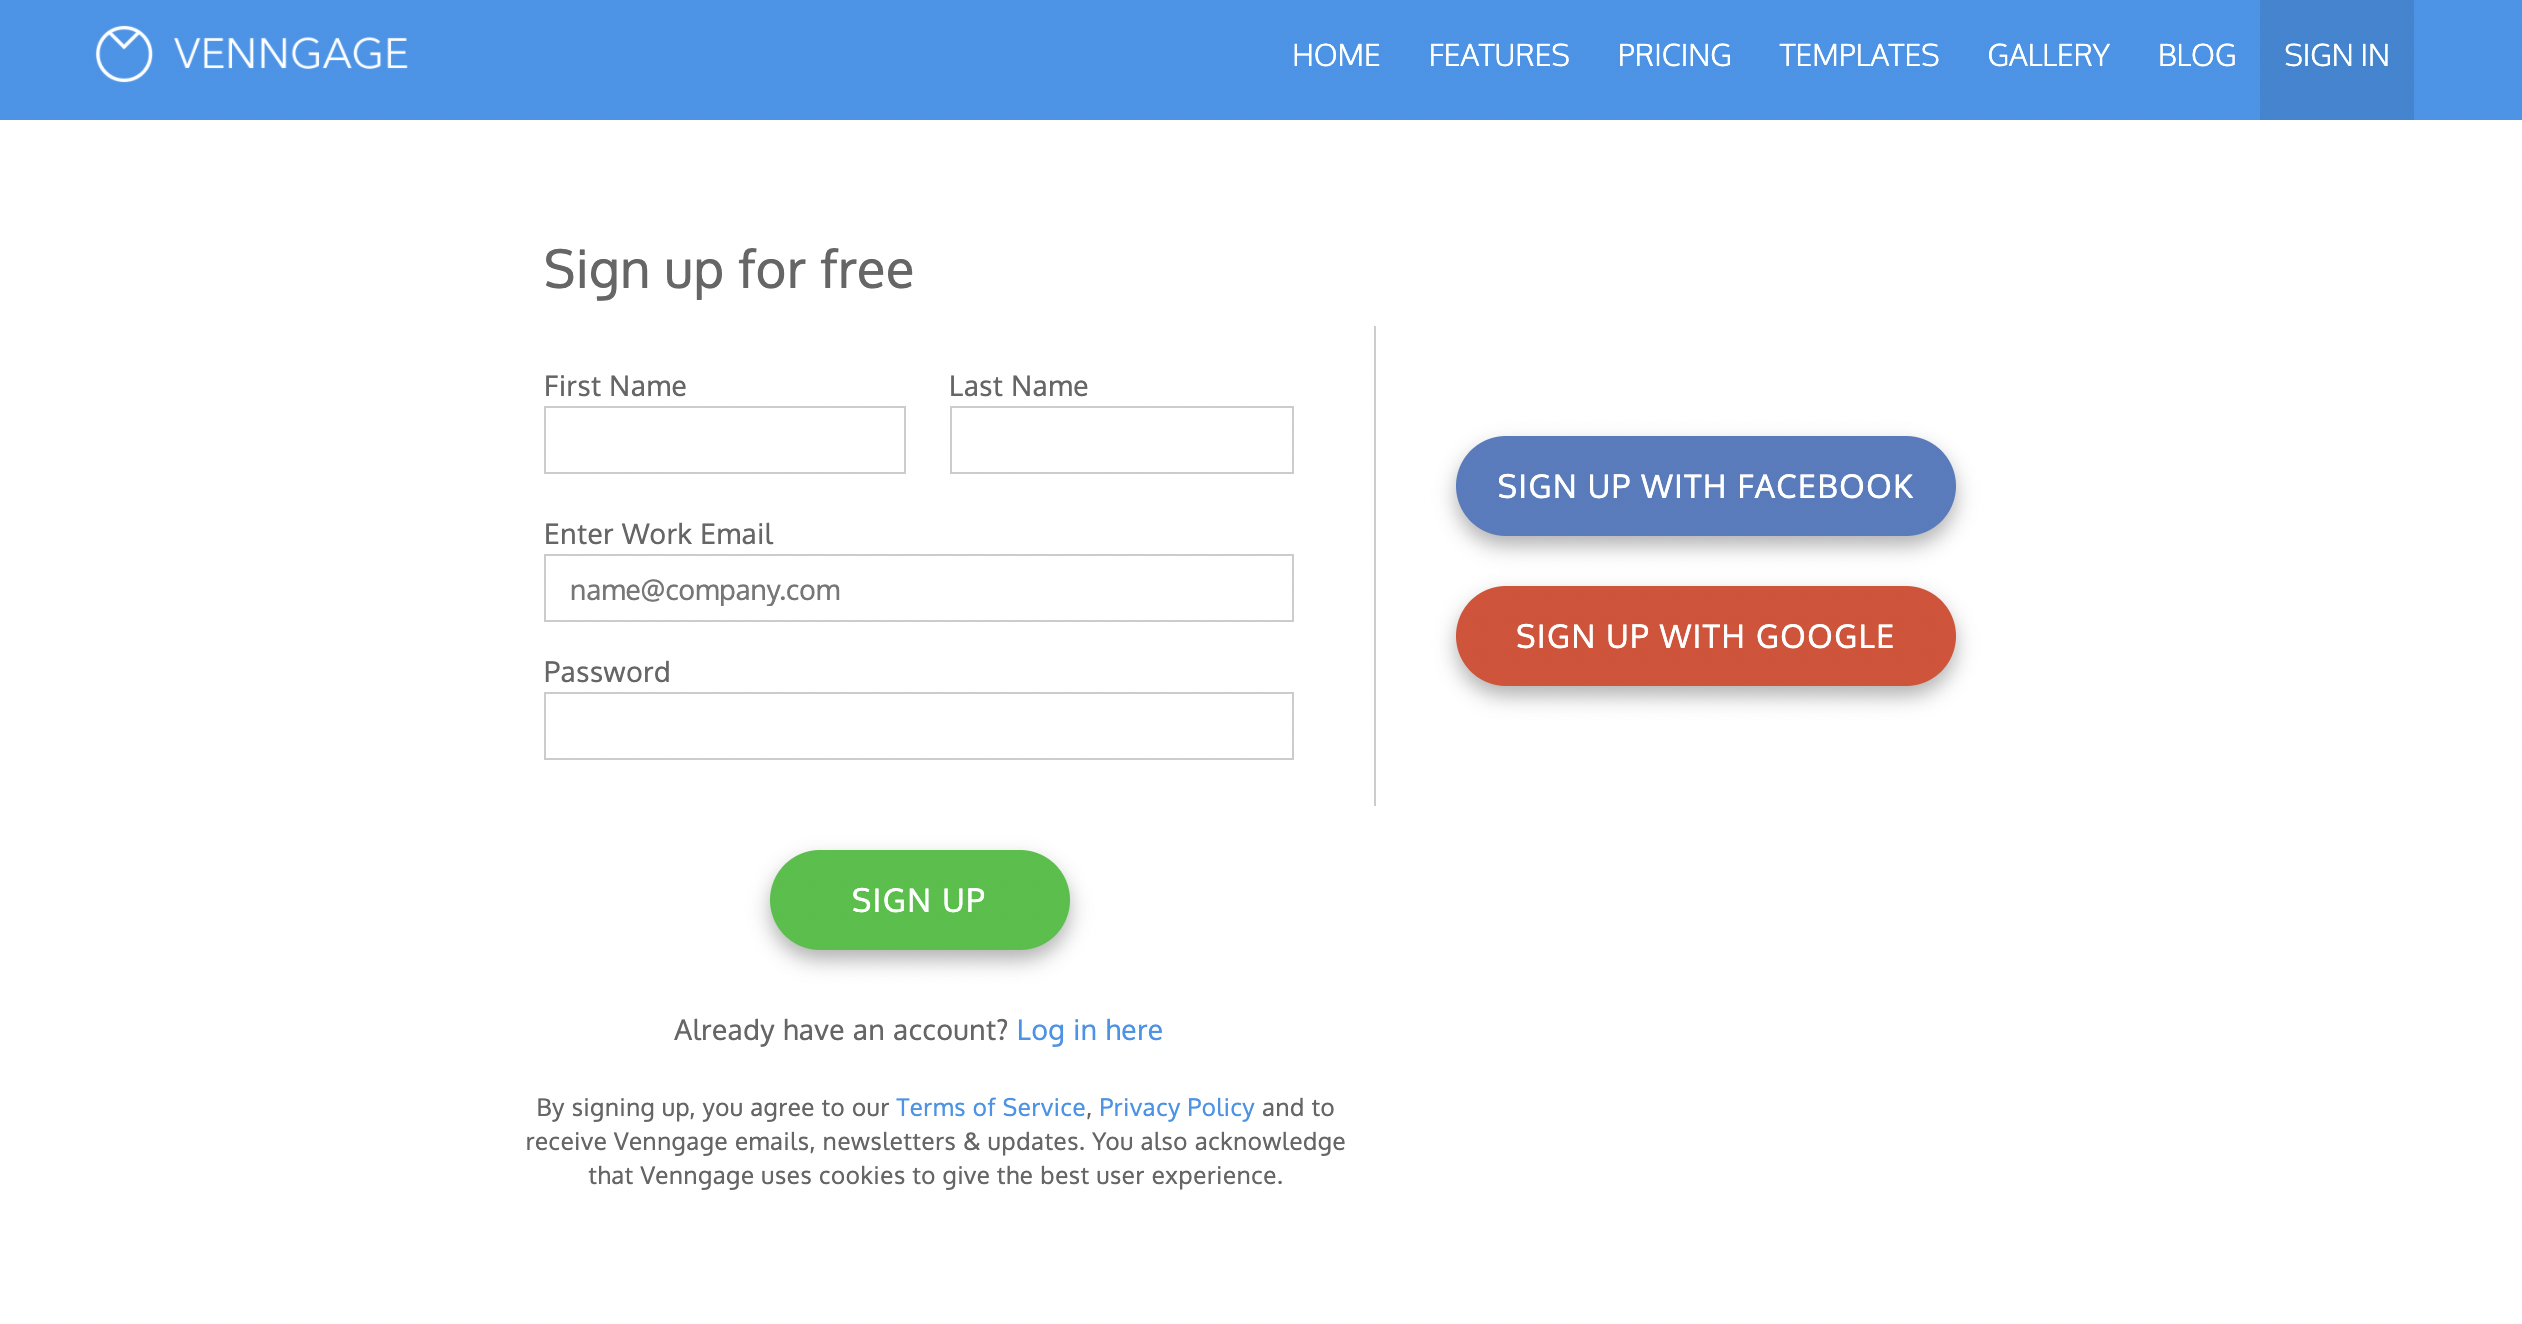
Then, you can sign up using your email, Gmail, or Facebook account.
Once you’ve picked your sign-up method, you’re prompted to pick what type of organization you’re representing. This gives Venngage a bit more information to help them curate templates related to your unique situation—whether you’re self-employed, a student, work for an enterprise, etc.
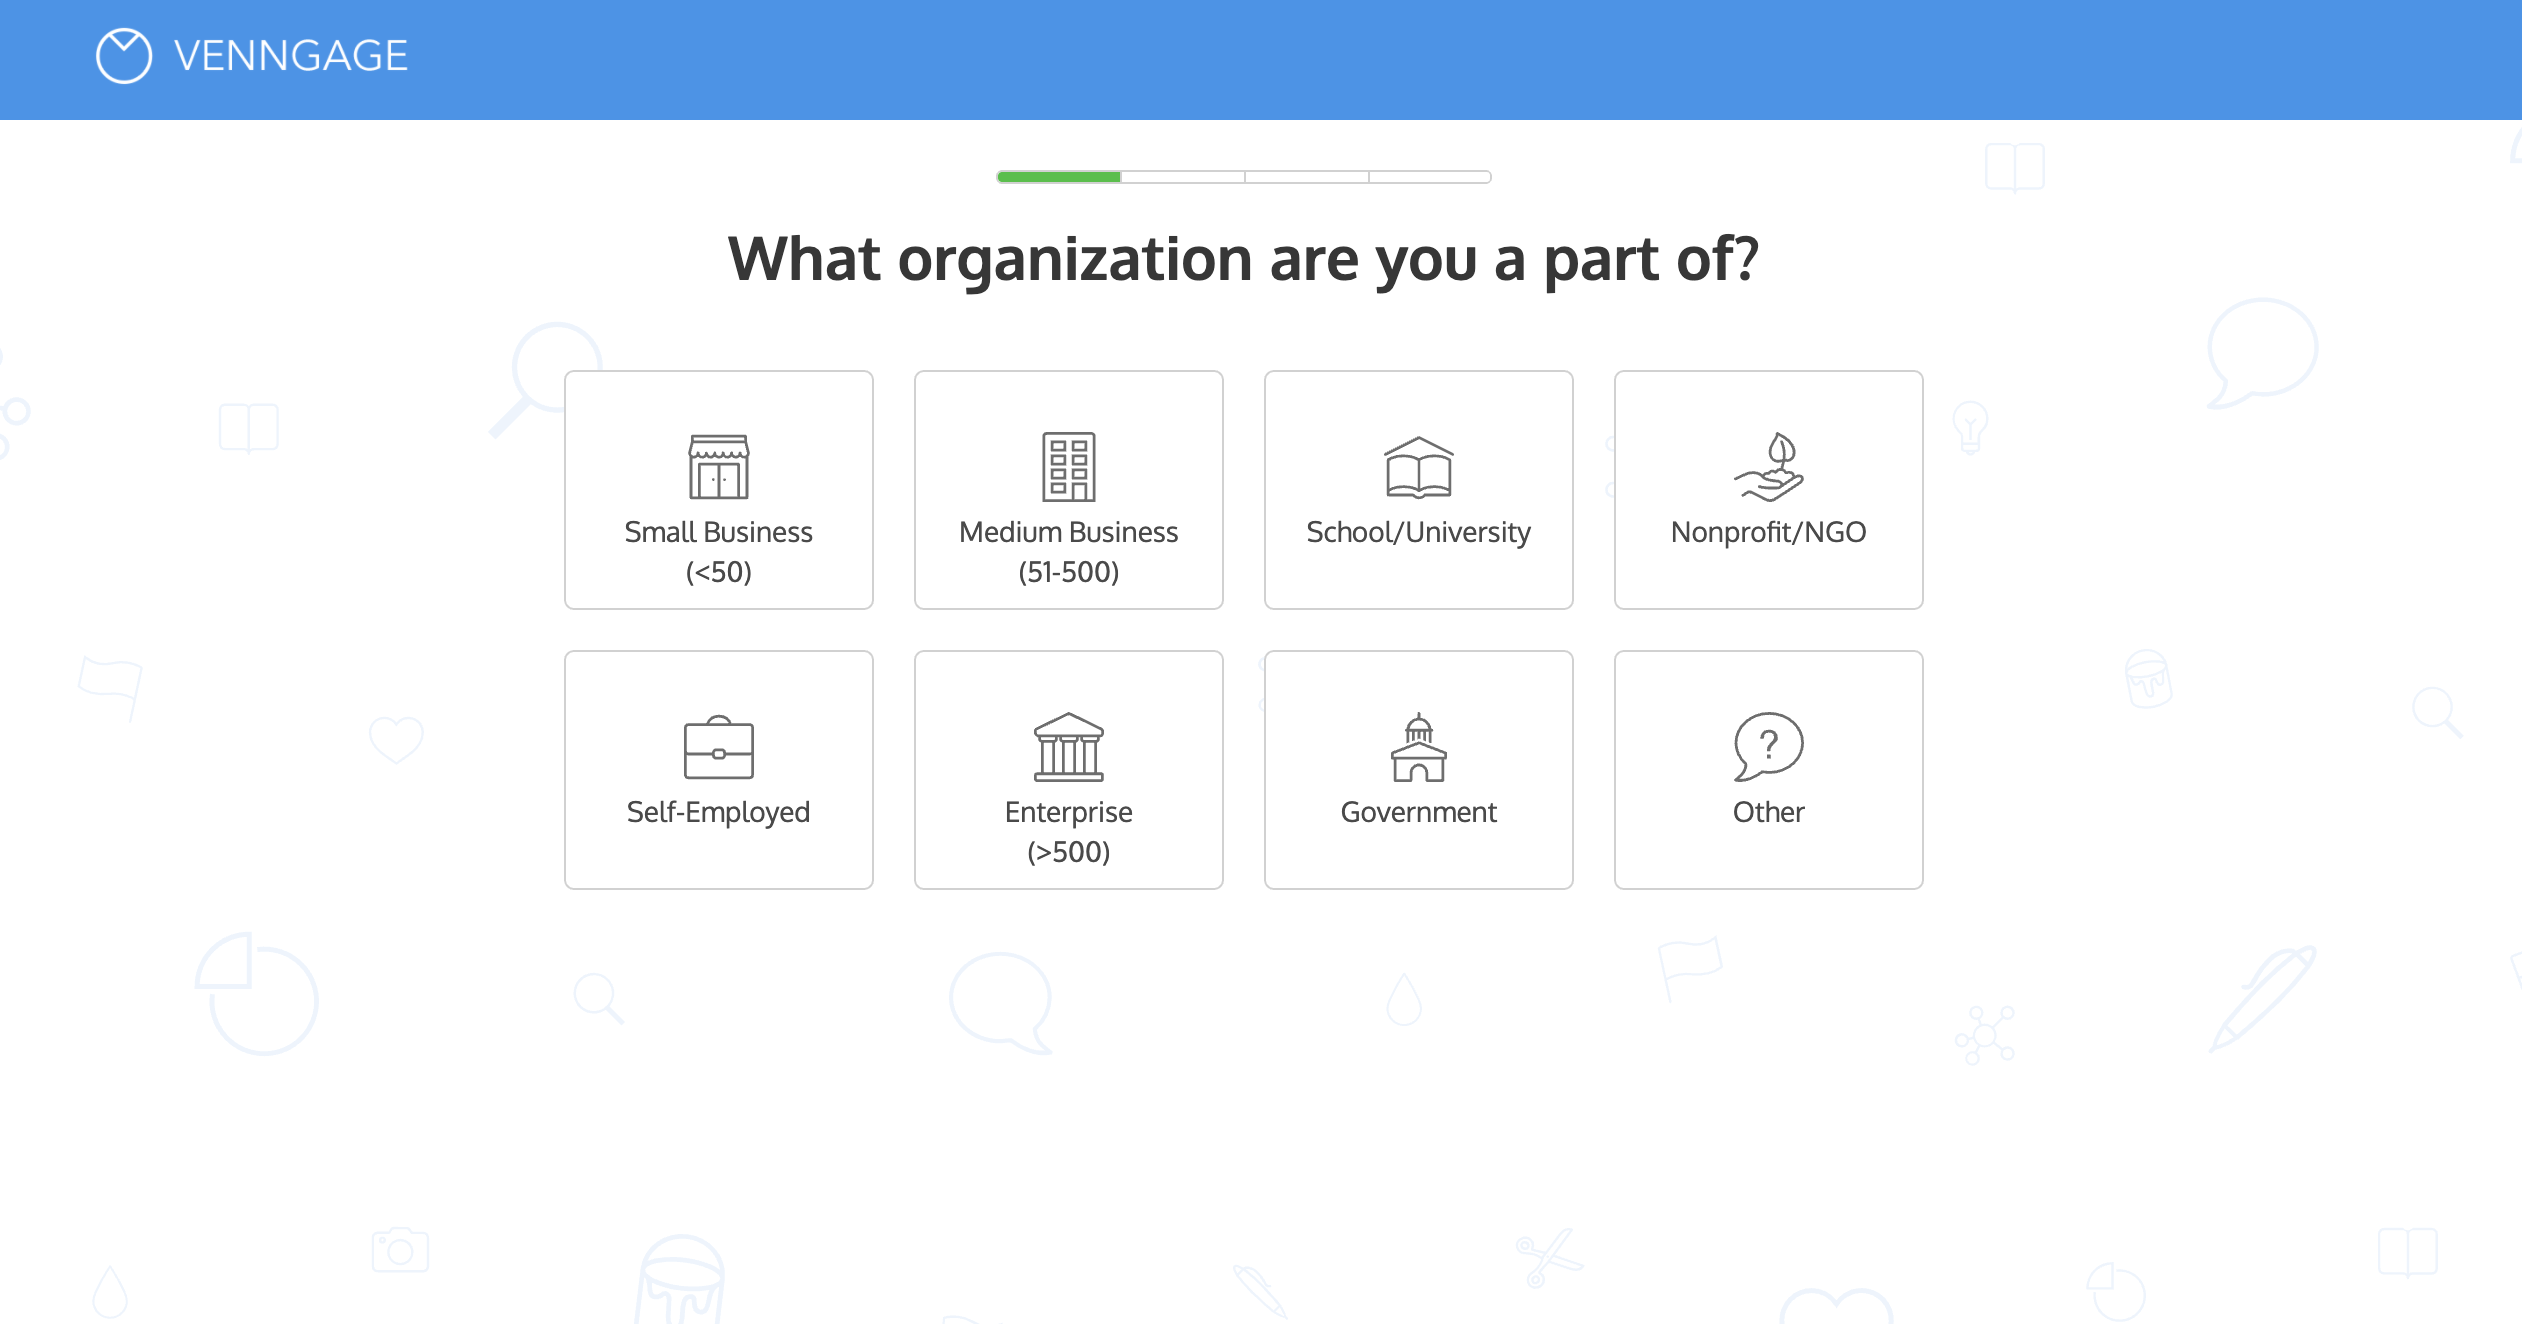
Then, Venngage customizes your experience even further by asking you what your role is at your organization.
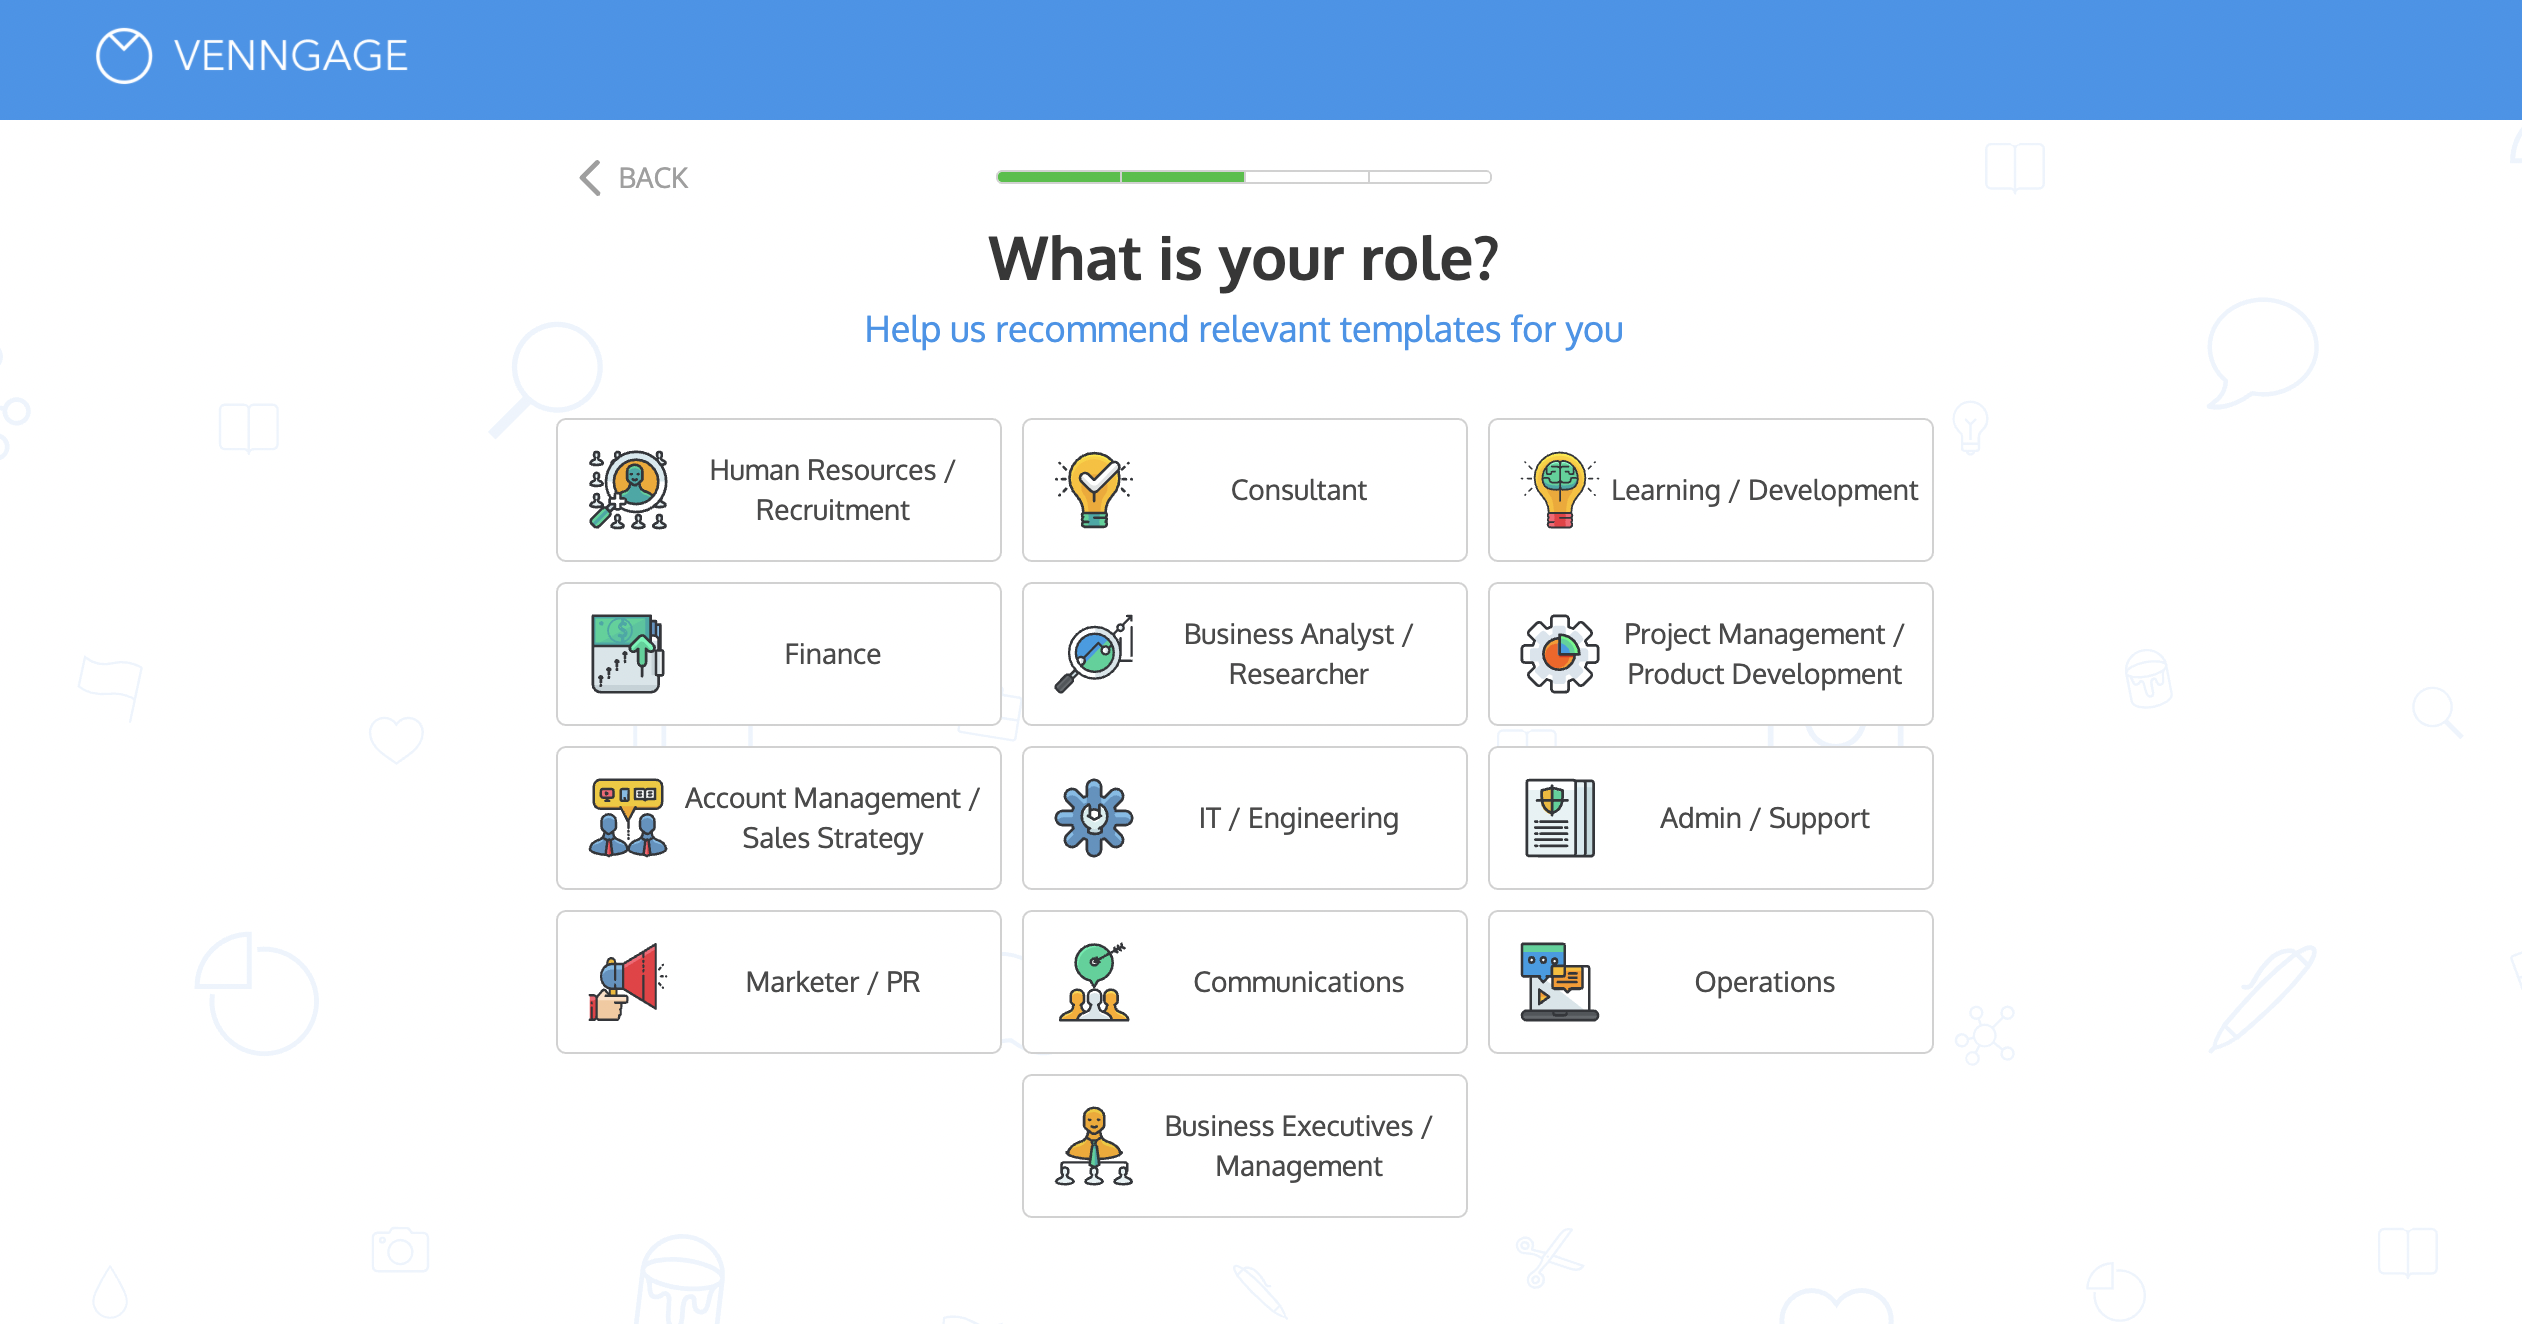
Then, you are prompted to pick three types of templates that you would like to create.

After that, you are prompted to pick three design styles that you like.
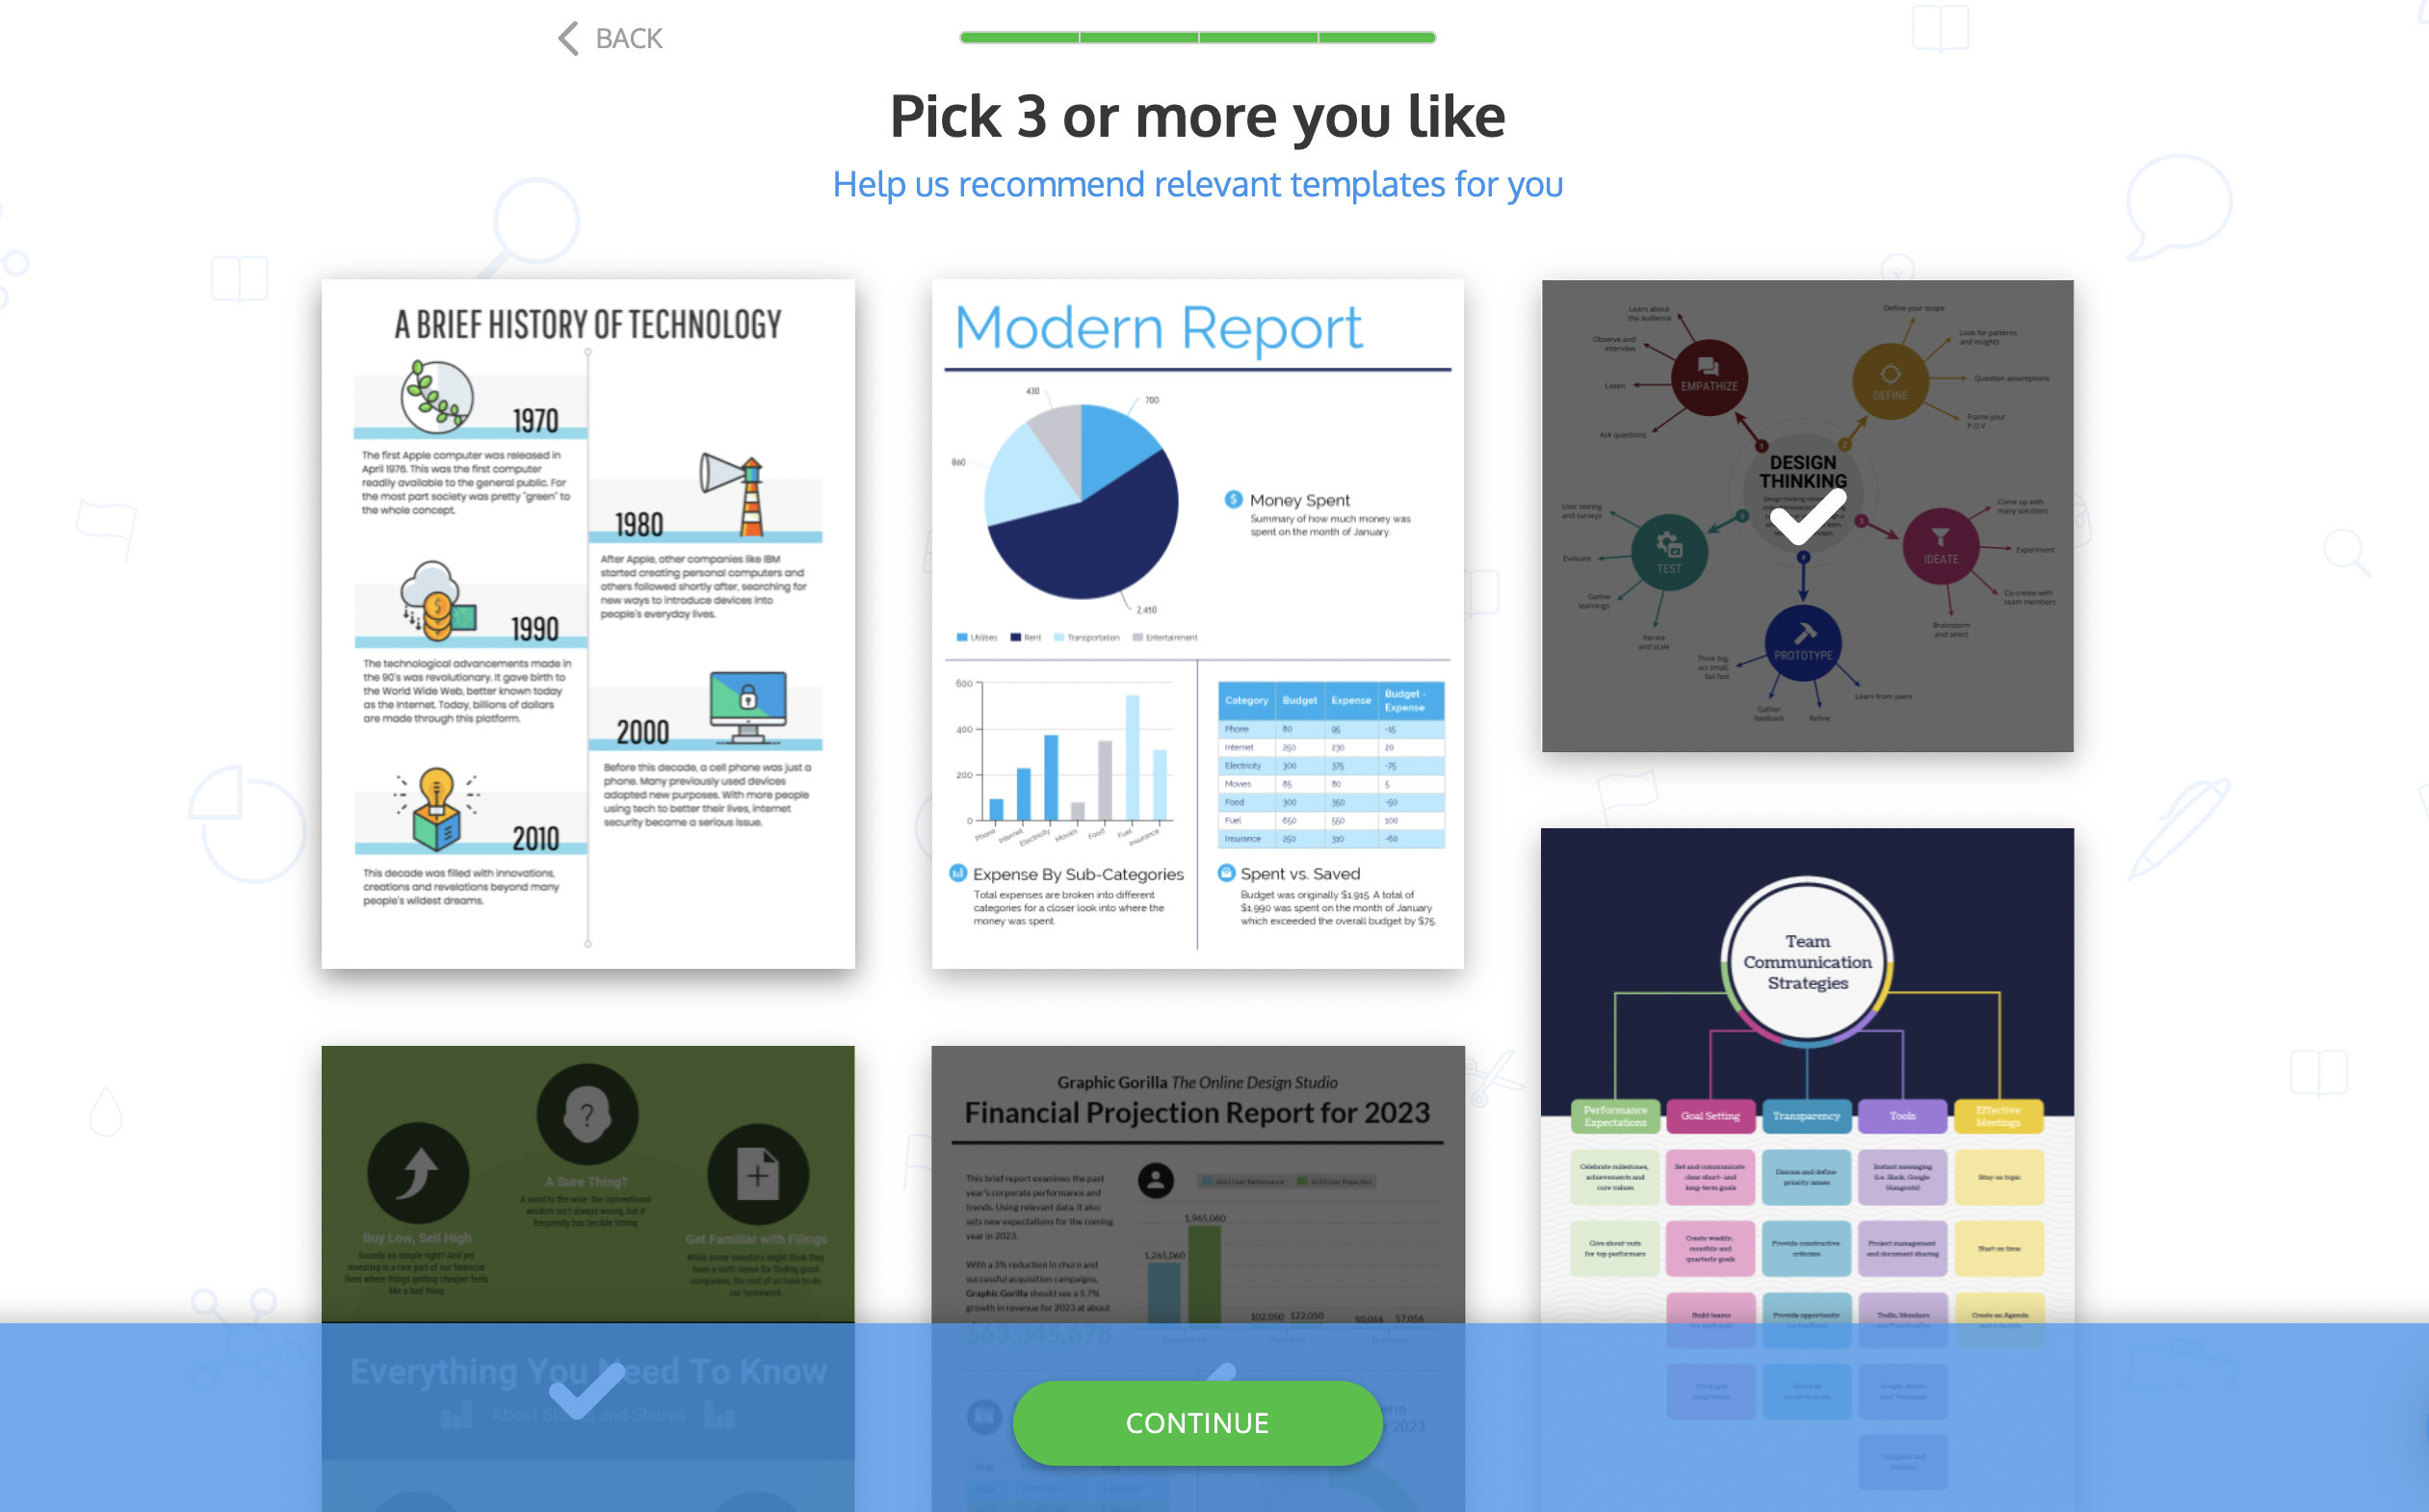
From there, Venngage takes you to their templates library. At the top of the Templates page is a selection of curated templates based on your answers. You can either explore the templates on your own or follows the prompt for a simple walkthrough of how to use the editor.

If you follow the prompt and click “Create”, you are taken into the editor where you can follow a walkthrough of some of the basic features.
Once you’ve completed the walkthrough, you can either jump into customizing the template or visit the Help page, which offers a library of video tutorials.

Picking a template: Venngage vs. PowerPoint
If you don’t have a lot of design experience, then creating an infographic presentation can be a bit intimidating. But anyone can design compelling infographics by starting with a template. Let’s take a look at PowerPoint and Venngage’s templates.
Picking an infographic presentation template with PowerPoint
PowerPoint offers a library of presentation templates in a variety of styles for you to choose from.
However, to get to the infographic presentation templates, you have to do a bit of digging. This makes it apparent right off the bat that infographic presentations are not their focus.
When you create a new presentation, PowerPoint offers 25 basic presentation templates to choose from. To search for infographic templates on their desktop app, you can use the search bar. This will yield a handful of infographic templates you can choose from.

But to see their full library of infographic templates, you will have an easier time looking on their web app:

You have to scroll down to the bottom of the page and click “Explore more templates and themes” to get to their full templates library. There, you can browse by template category. “Infographics” can be found all the way at the bottom of their category list.

Overall, PowerPoint’s offering of infographic presentation templates is limited—they only offer two pages of infographic templates to choose from.
Picking an infographic presentation template with Venngage
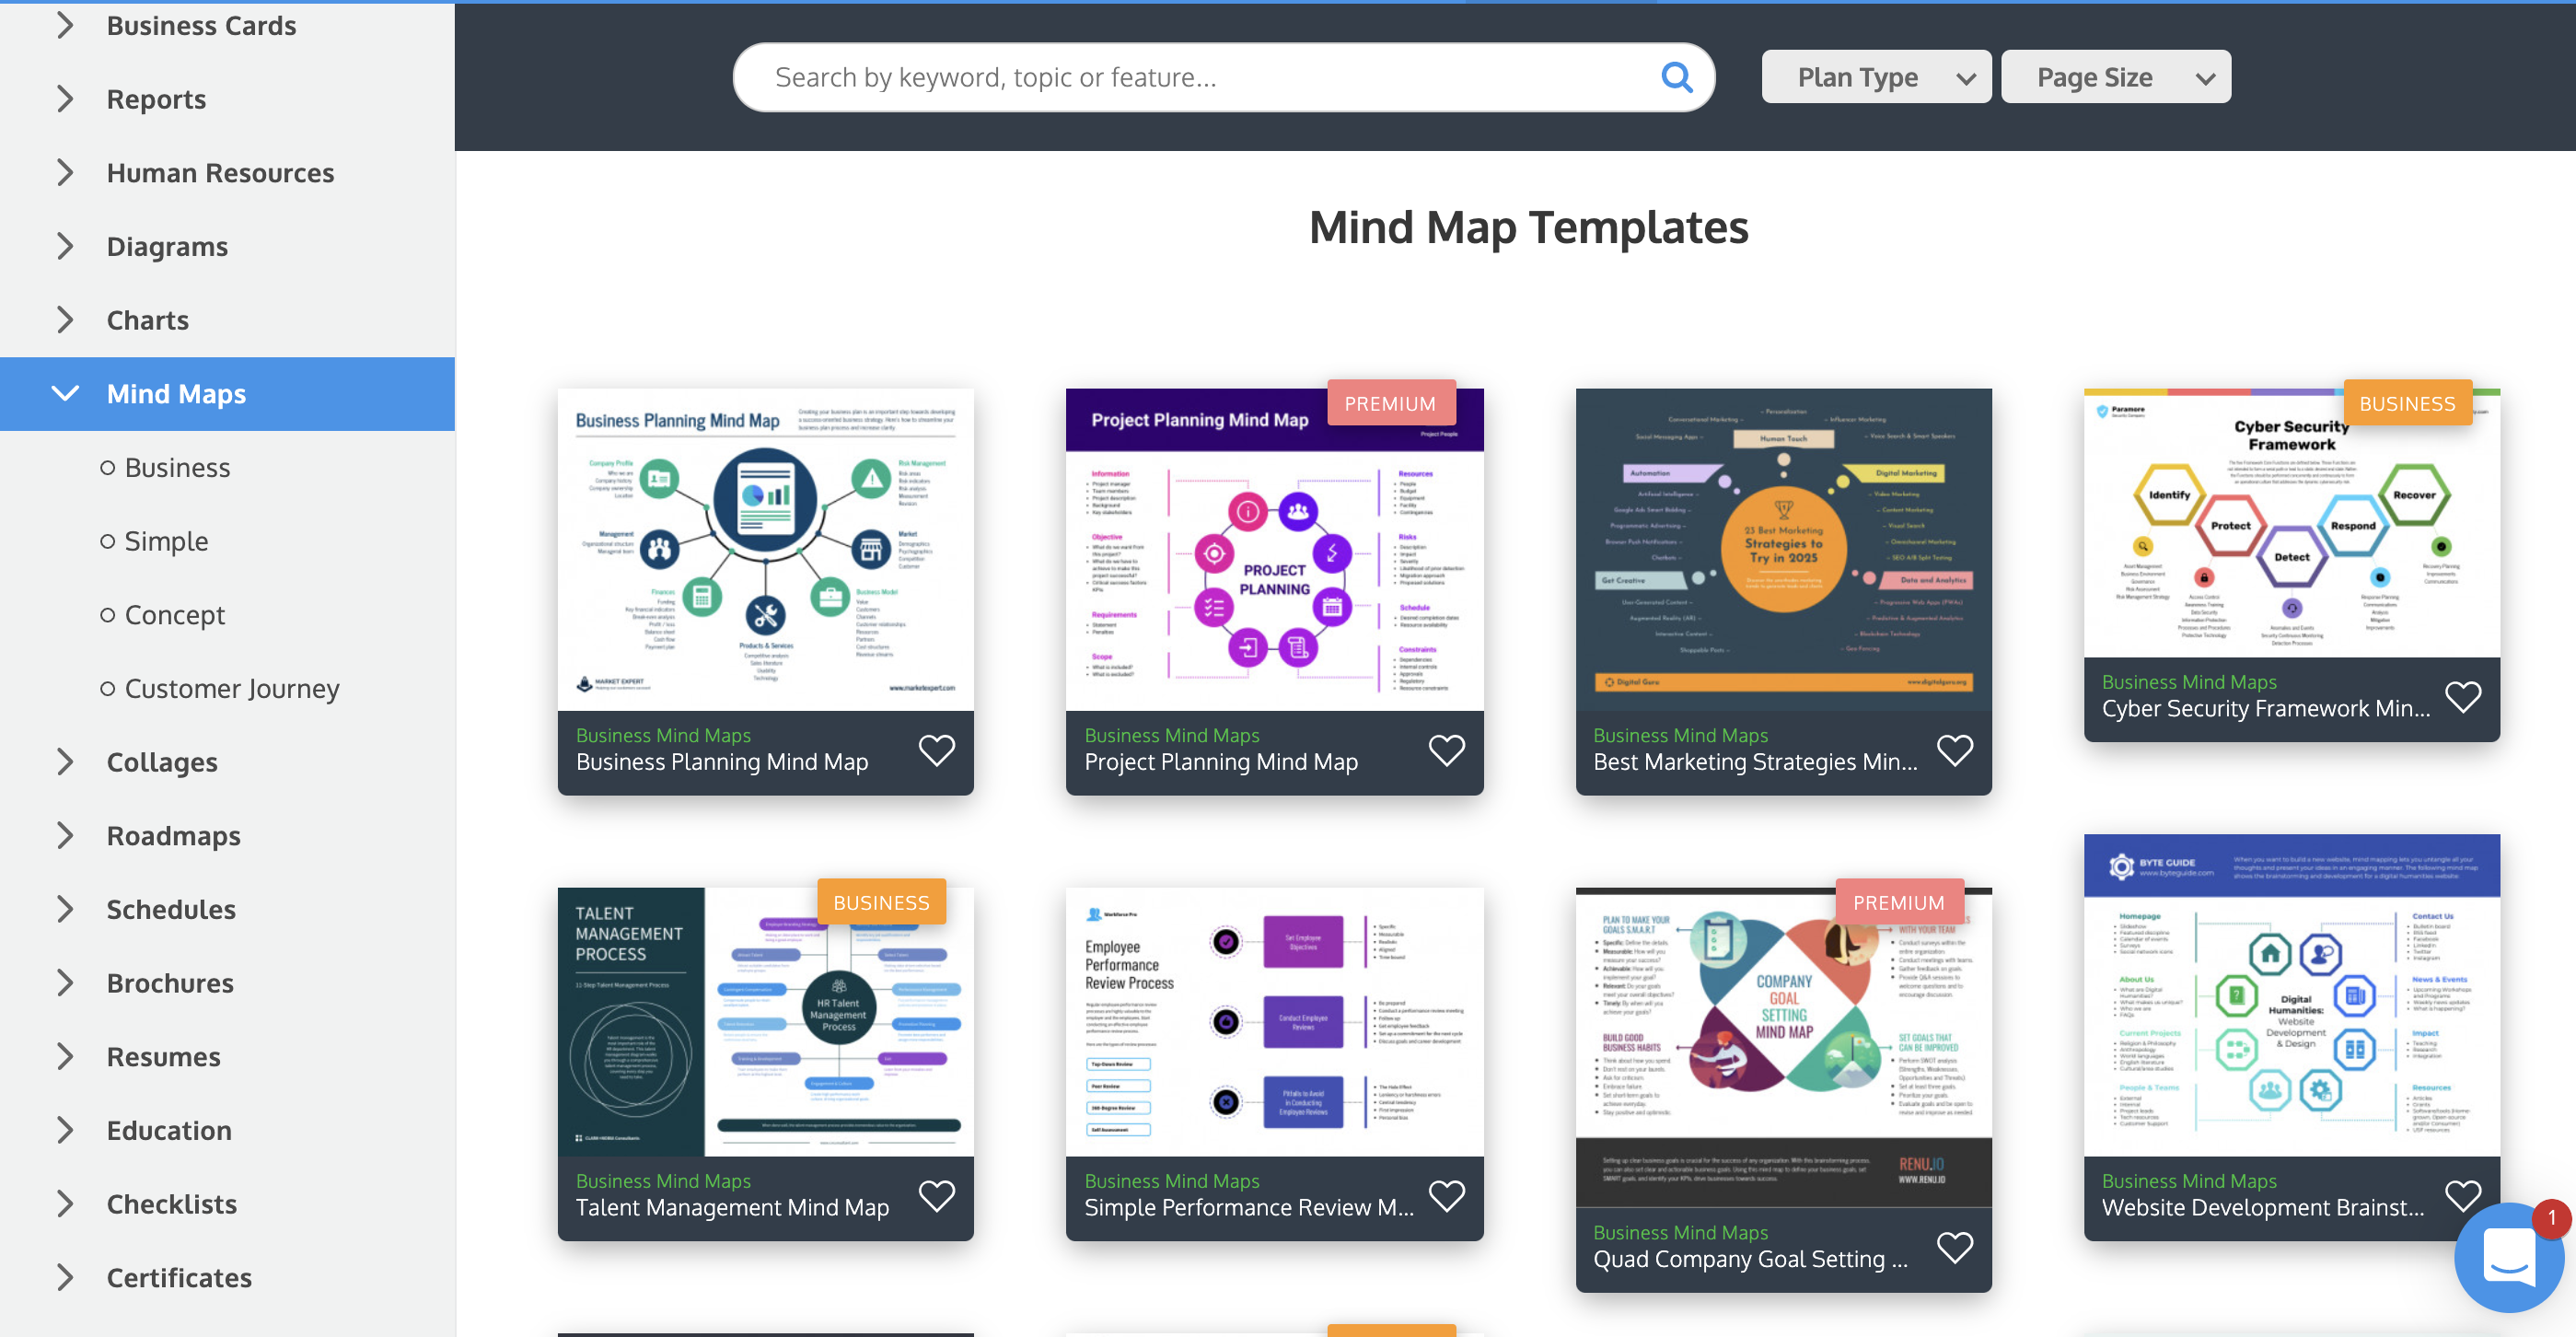
Venngage offers an extensive library of infographic templates. You can either pick from one of the curated Recommended templates at the top of the page or pick a specific type of template using the left-hand menu.
From there, you can drill down on a specific type of presentation you would like to create, including pitch decks, keynote presentations, business presentations, and more.
You can use the top navigation bar to search by keywords, plan type (Free, Premium, Business), or page dimensions.
While you’re browsing, you can click on the hearts to “favorite” templates you like. This will save them to your Favorites folder in the left-hand menu. This makes it easy to save templates for specific use cases and styles.
Browsing through Venngage’s templates, you can find a variety of different template styles— simple and functional, sleek and professional, quirky and trendy. That makes it easy to find a template that fits the tone and style of presentation you want to create.
If you want to create a presentation design from scratch, simply use the blank canvas.
Infographic presentation templates: PowerPoint vs. Venngage
Now let’s take a closer look at the types of infographic templates offered by both platforms.
PowerPoint’s infographic presentation templates
As already mentioned, PowerPoint’s selection of infographic presentation templates is limited. They offer a few templates for basic types of infographics like timelines, percentage charts, and process paths.

It’s important to note that many of their infographic templates are only single-slide templates. To use an infographic template, you can copy the individual slide into your presentation.
If you want multi-slide infographic templates, you will need to look on third-party sites.
Types of chart templates
PowerPoint offers a selection of standard charts that you can use in your presentation:
- Column (2-D, 3-D)
- Line (2-D, 3-D)
- Pie (2-D, 3-D)
- Hierarchy
- Statistical
- Scatterplot
- Waterfall
- Maps
- Combo charts
They also offer a library of “SmartArt” which includes templates for showing processes, lists, hierarchies, and matrixes.

Their charts, like all of their visuals, are simple and a bit dated. They also have that distinct “PowerPoint” look—which is why PowerPoint presentations tend to all look very similar. If you want to create infographic presentations that are sleeker and more creative, you will probably have to look for external templates.
Other visuals
Icons: PowerPoint offers a library of simple icons to add to your designs. If you’re looking for simple icons to add to your presentations, they get the job done. But if you’re looking for icons with a more creative design, you will need to source them externally.
![]()
Shapes: In addition to their icons, PowerPoint offers a selection of shapes you can use, like rectangles, diamonds, and arrows.

Photos: PowerPoint has a library of stock photos for your to choose from. You can search for images using keywords.

Fonts: With PowerPoint, you can use any of the standard fonts provided in all Microsoft Office 365 apps.

Venngage’s infographic presentation templates
Because infographics are Venngage’s specialty, they offer a wide selection of infographic presentation templates to choose from. All of their presentation templates include multiple infographic slides, so you can create a presentation with a variety of different data visualizations, all with a cohesive design style.
Venngage also offers a wide selection of templates for other types of data-focused visuals that you can incorporate into your presentations, like mind maps, flow charts, diagrams, and roadmaps.
A differentiating factor between Venngage and PowerPoint’s templates is the content.
By default, PowerPoint’s templates are all blank. But Venngage’s templates all contain example content for whatever type of information the template is designed for. This can be useful if you’re not sure which presentation template to choose from, or what types of charts will best display your data.
Types of chart templates
Venngage provides all of the essential charts you need to visualize data for a wide variety of use cases:
- Line charts
- Column and bar charts (2-D, 3-D)
- Stacked column and bar charts
- Pie charts (2-D, 3-D)
- Area charts and stacked area charts
- Half pie charts
- Maps
- Word clouds
- Bubble charts and stacked bubble charts
- Pyramids
- Funnel charts
- Pictograms
- Multi-series charts
- Scatterplots
- Treemaps
- Tables
Other visuals
Icons: Venngage has an extensive library of 40,000+ icons, many of which can be edited to use your brand colors. Their icons are entirely free to use.
![]()
Illustrations: Venngage offers an extensive collection of diverse and inclusive icons for a variety of different industries, jobs, and use cases.
![]()
Photos: Venngage’s stock photo library is integrated with Unsplash and Pixabay, giving you access to thousands of beautiful photos. You also have the option to upload and store your own photos.
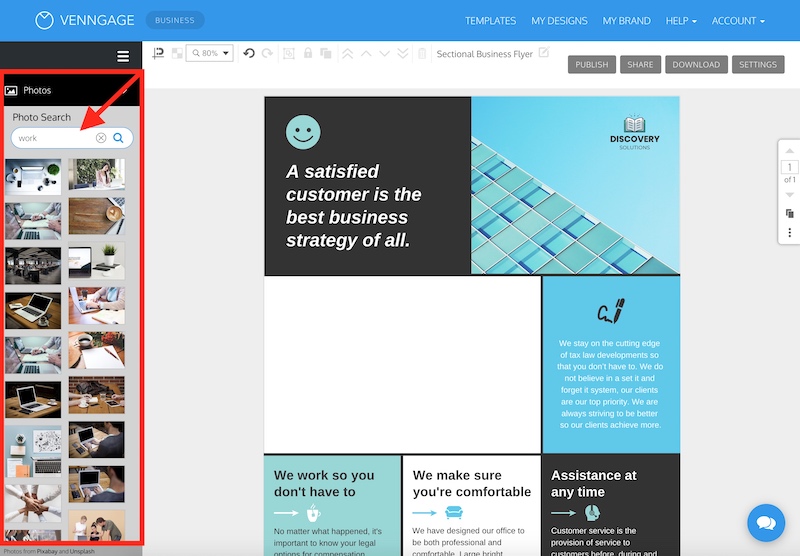
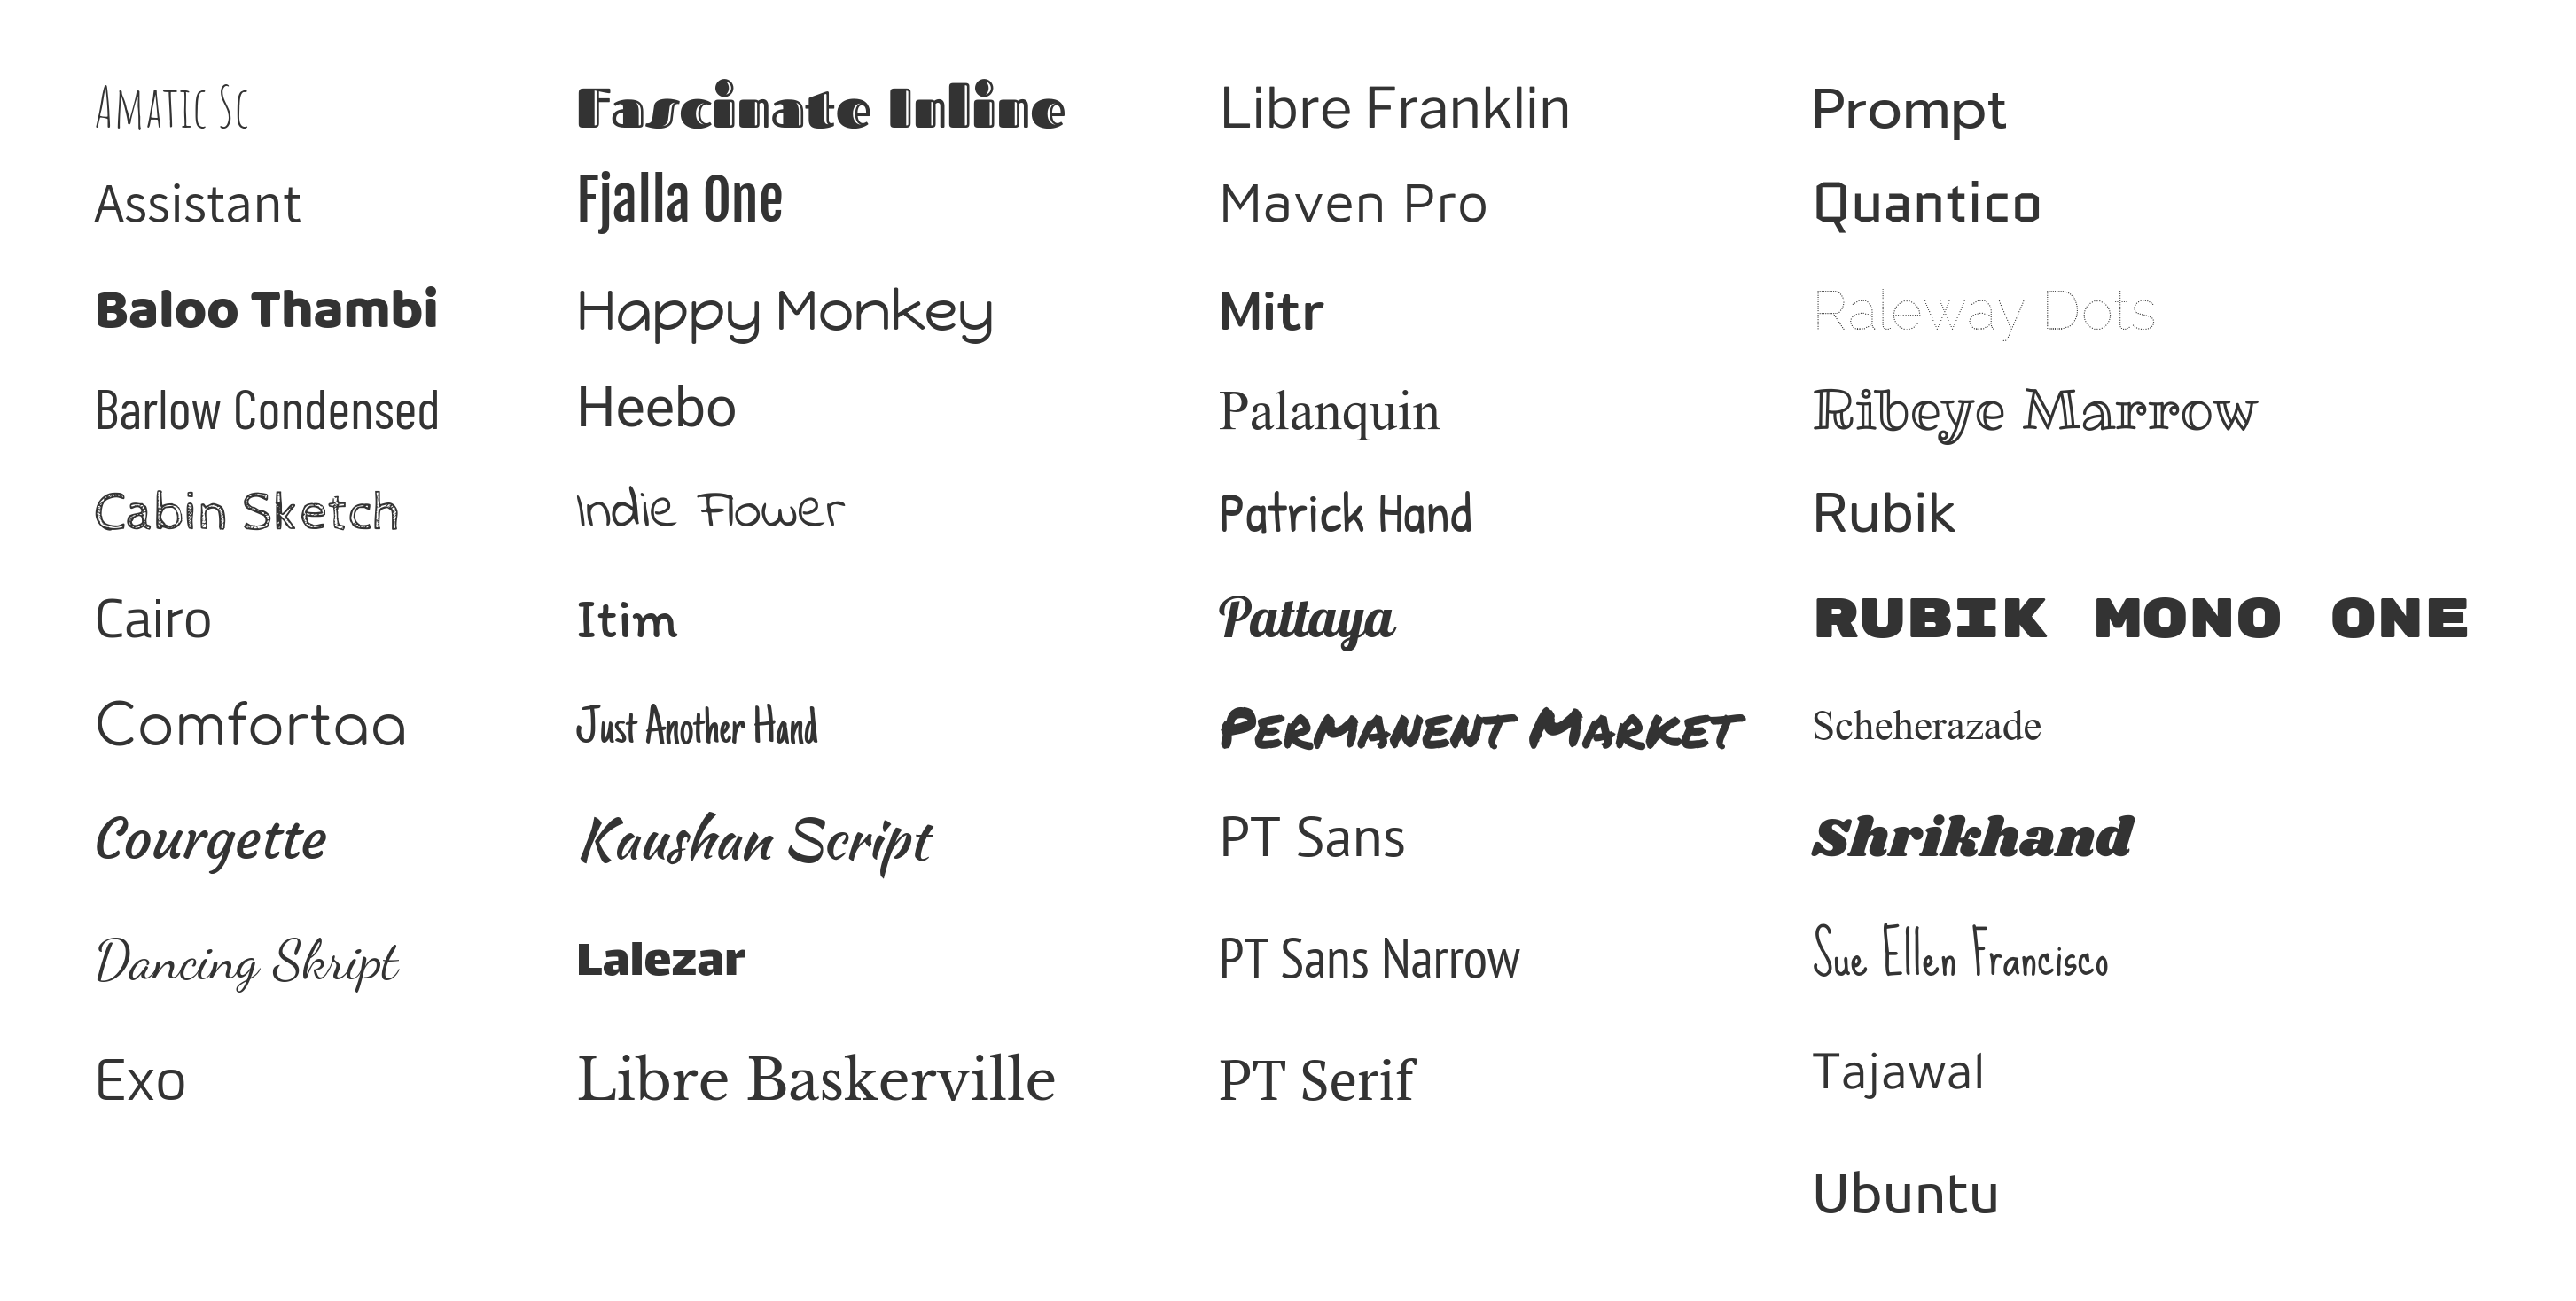
Fonts: Venngage provides hundreds of popular fonts. You also have the option to upload and save your fonts.
Editing an infographic presentation: Venngage vs. PowerPoint
Now, let’s get to the meat of it. Which design solution provides a better experience for editing infographics?
Editing an infographic presentation in PowerPoint
Like Microsoft Office 365’s other apps, PowerPoint features a blank page that you can customize using the top menu. If you’re familiar with Microsoft’s other apps, then the language and functionalities offered in the menu will likely be familiar to you.
Adding and editing charts
First things first: to use PowerPoint’s chart tool, you will need to be using PowerPoint’s desktop app. The chart tool is not available on their web app.

To edit the chart, you will need to edit the values in the Excel chart that pops up. This could be another potential roadblock if you don’t also have (and know how to use) Excel.

To customize your chart design, you need to click on the individual elements in the chart to customize the color, opacity, size, etc.
Overall, the experience of editing charts in PowerPoint is a bit clunky. You have to jump between two screens and do some maneuvering to customize the design.
Adding and editing icons
To add icons to your presentation in PowerPoint, go to Insert > Icons in the top menu. That being said, I first had to find a way to add the Icons option to the menu in the PowerPoint desktop app because it wasn’t there by default.
This is a general pain point when using PowerPoint—some features are available on desktop by default but not on the web app and vice-versa. You will likely have to do some Googling to figure out how to find the features you want to use.
![]()
You have the option to customize the icon using the Format Graphic menu.
![]()
Adding and editing photos
To add photos to your presentation in PowerPoint, you can upload your own photos or select from their stock photo library.

They have a handy feature that suggests how you layout photos on the slide.

You can also customize the photo styles using their design features in the top menu:

Aligning elements on your slides
To align elements on your slide, you can select Alignment options under “Format”. PowerPoint also offers simple guides when you move around elements on the slide.

Editing an infographic presentation in Venngage
Venngage has a simple drag-and-drop editor. This makes it easy to add, substitute, and remove elements in your presentation design. Venngage is also hosted entirely in the cloud, meaning you can edit your designs anywhere you have an internet connection.
You can select specific design elements from the sidebar, like charts, and icons and a top menu where you can customize design elements.

Another big plus: Venngage’s extensive icon and photo libraries are completely free to use.
Venngage has 23,000+ free icons and over 3 million free stock images that you can browse in the Venngage editor and add to your infographic immediately.
Adding and editing charts
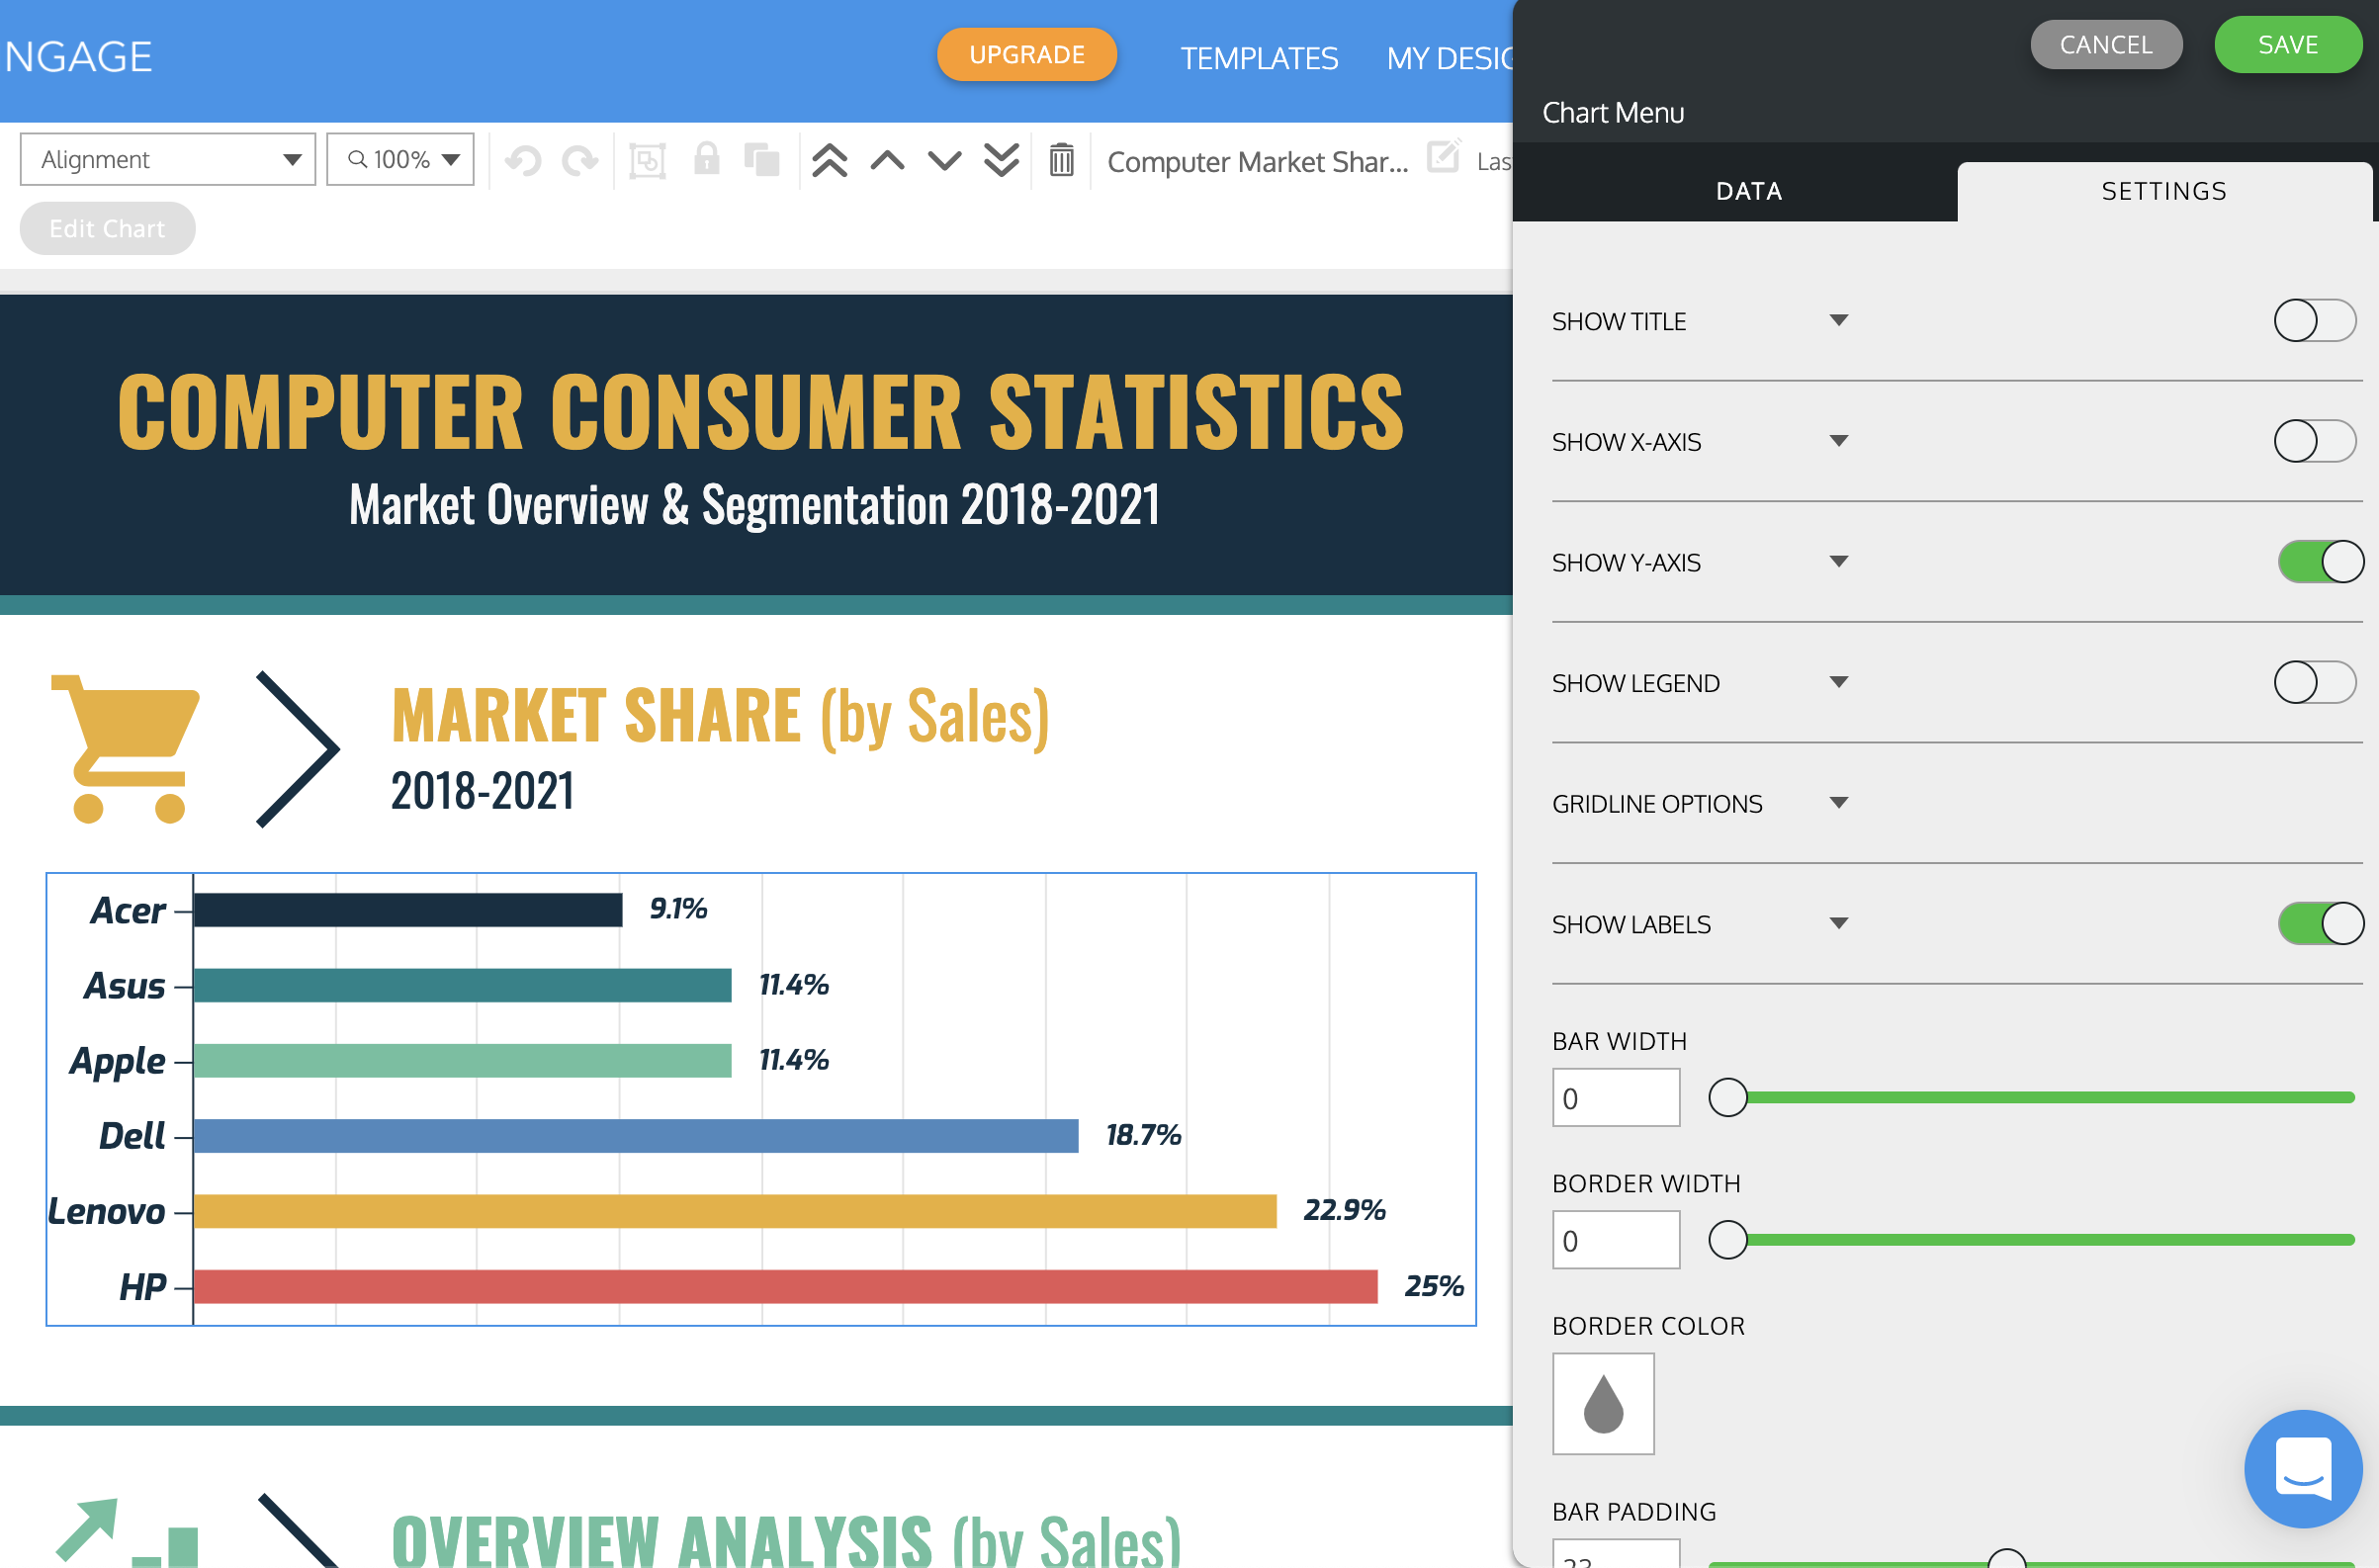
When you select a chart, Venngage’s chart editor opens up on the side of your screen:

You can easily adjust the chart values, colors, and fonts. You can also swap out the chart type using the editor and the chart will automatically update in the template, without you having to move it around.

You can also customize the labels, legend, and axis text on your charts. This makes Venngage’s chart feature flexible to however you want to display your data. Plus, you don’t have to switch back and forth between two screens.
Adding and editing icons
Venngage’s icons are one of the features that really set them apart. They offer a huge library of diverse icons, with the option to change skin color.
![]()
There are two ways you can add and replace icons in your Venngage template. One is to search for icons in the side menu:
![]()
The other is to double-click on an icon in your template to open the Replace menu.
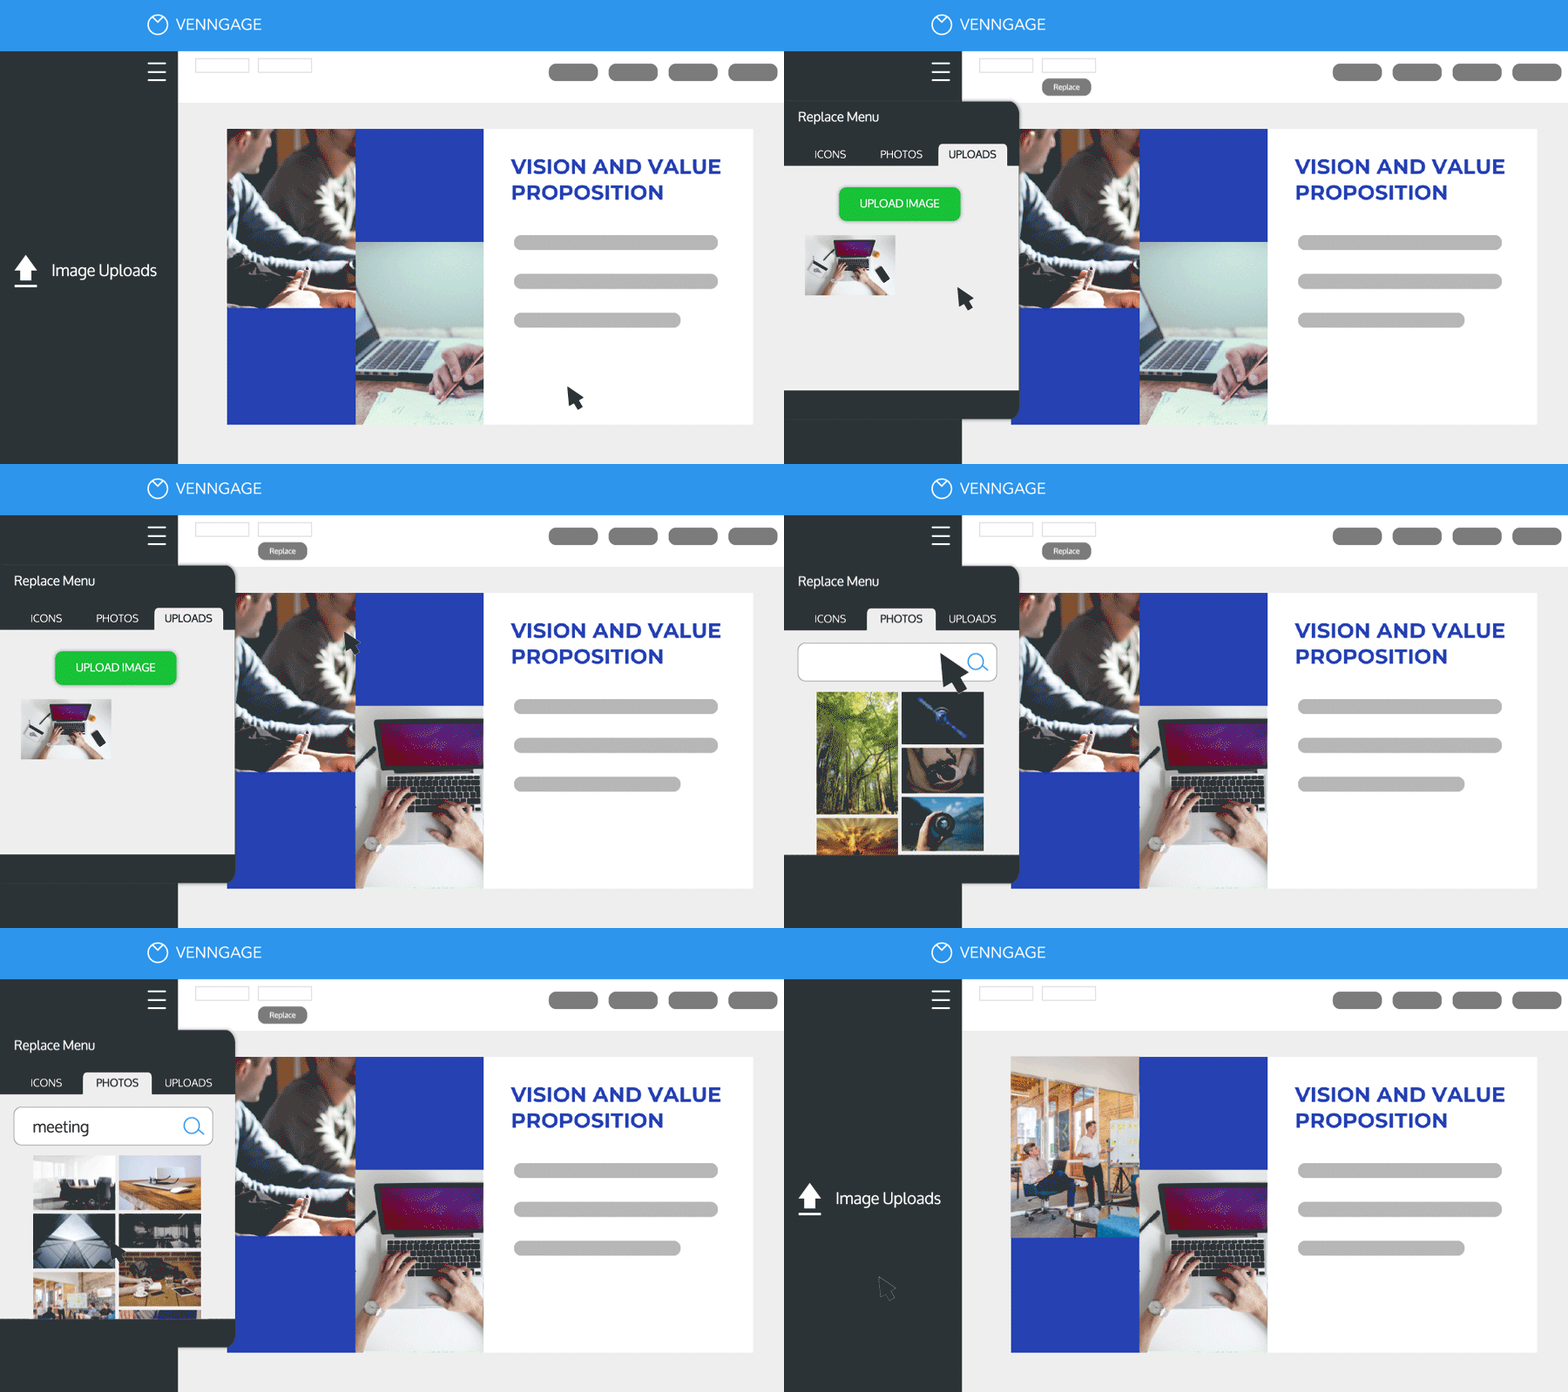
All you need to do is search for a new icon or photo, select one, and the icon will automatically be replaced in the same position in your template, in the same color as the original. This makes replacing icons quicker in Venngage than in PowerPoint.
![]()
Adding and editing photos
Venngage gives you the option to upload your own photos or to pick from their stock photo library with over one million photos—all for free.
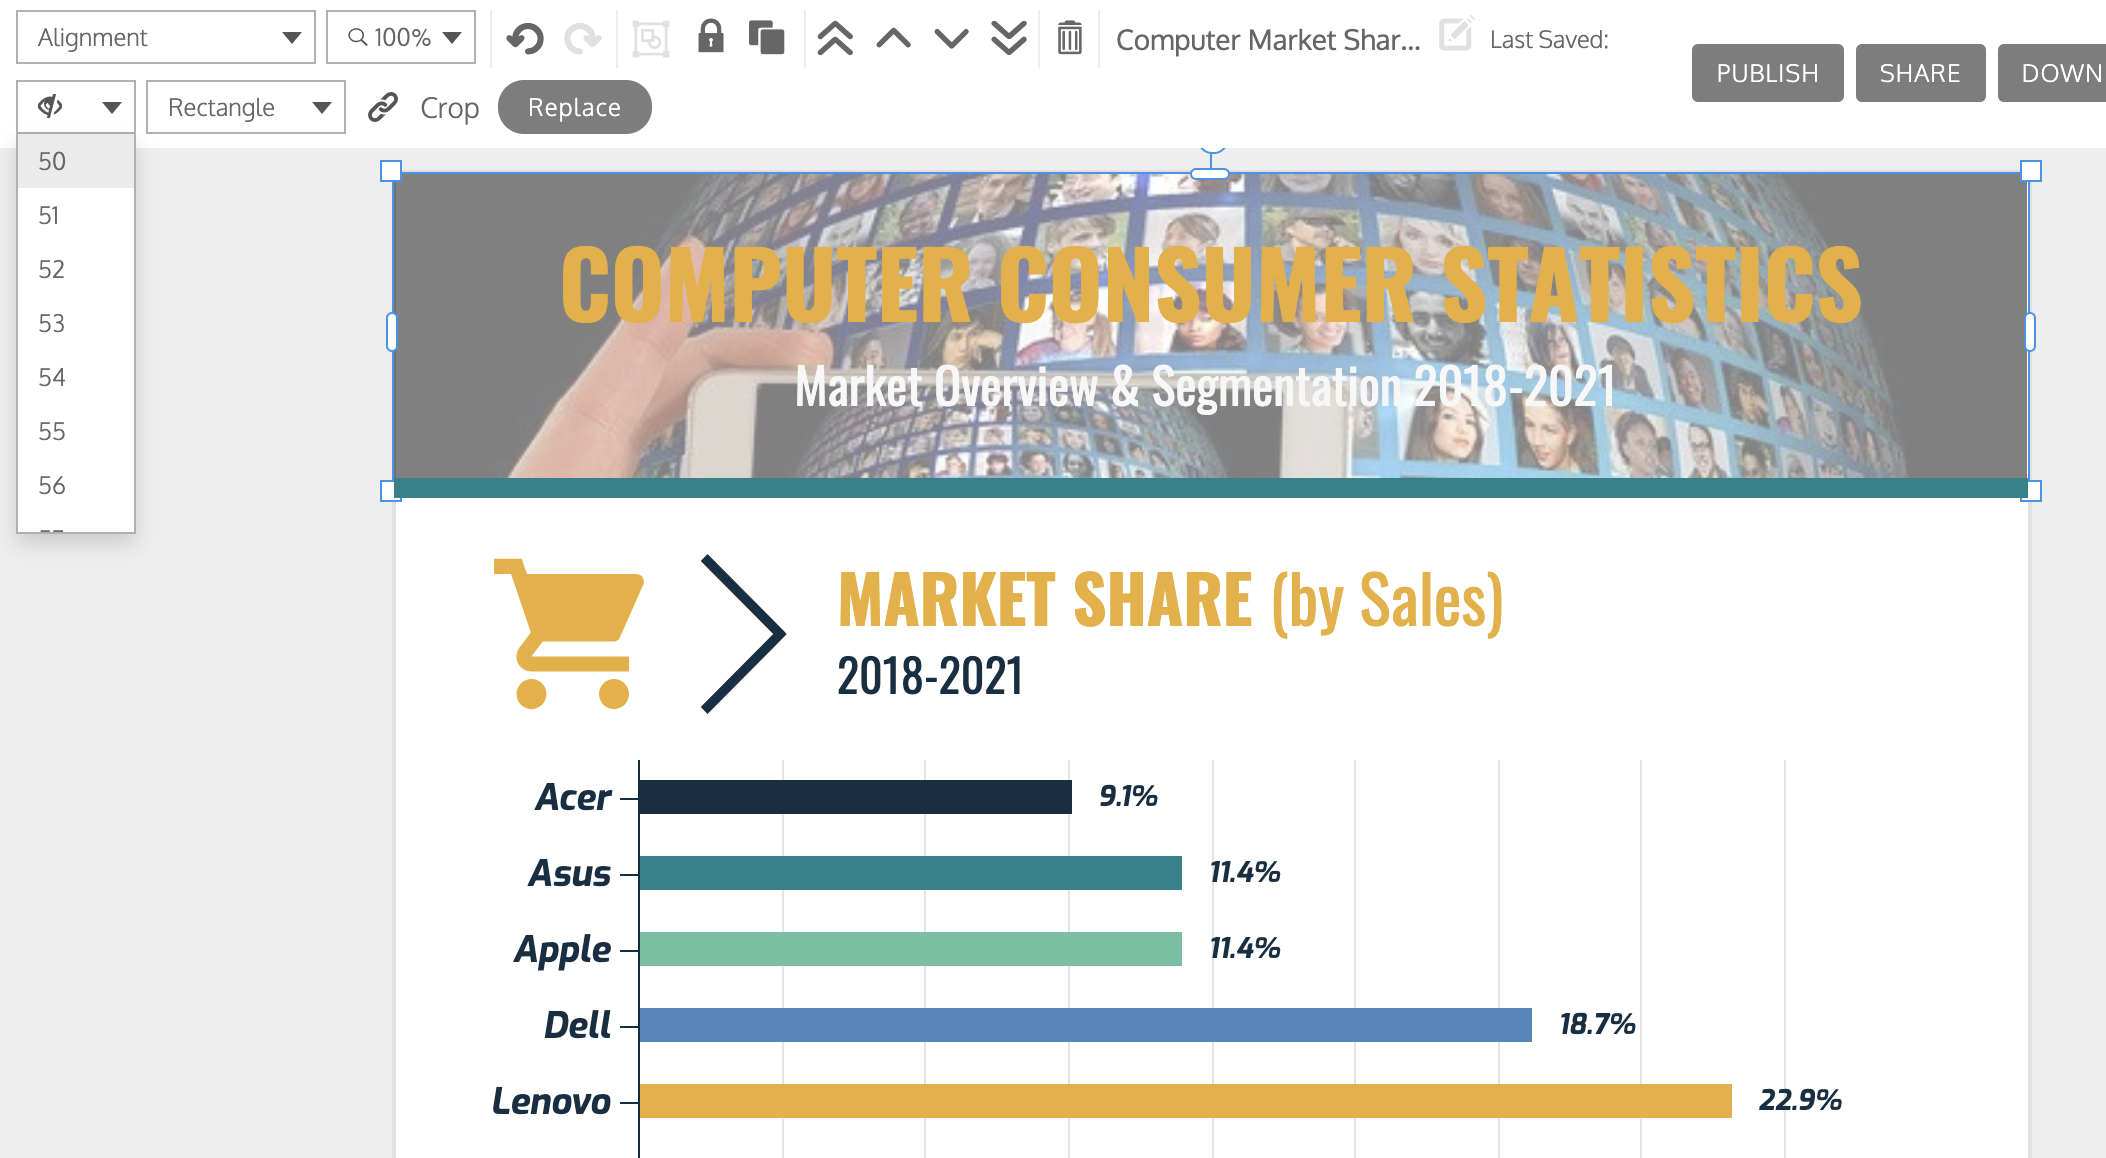
You can easily adjust the dimensions of a photo using toggles, as well as adjust the opacity of the photo to help it fit seamlessly into your design.
To swap a photo with an icon, an uploaded photo, or an image from our stock photo library, you can use the Replace menu again.
A cool feature that Venngage offers is its image frames. This makes it dead simple to integrate photos into your designs using different shaped borders. You can also adjust the image opacity and add different color filters using the design options in the top menu.

Overall, Venngage’s photo features are geared towards making it easy to integrate photos seamlessly into your infographic designs.
Aligning elements on your slides
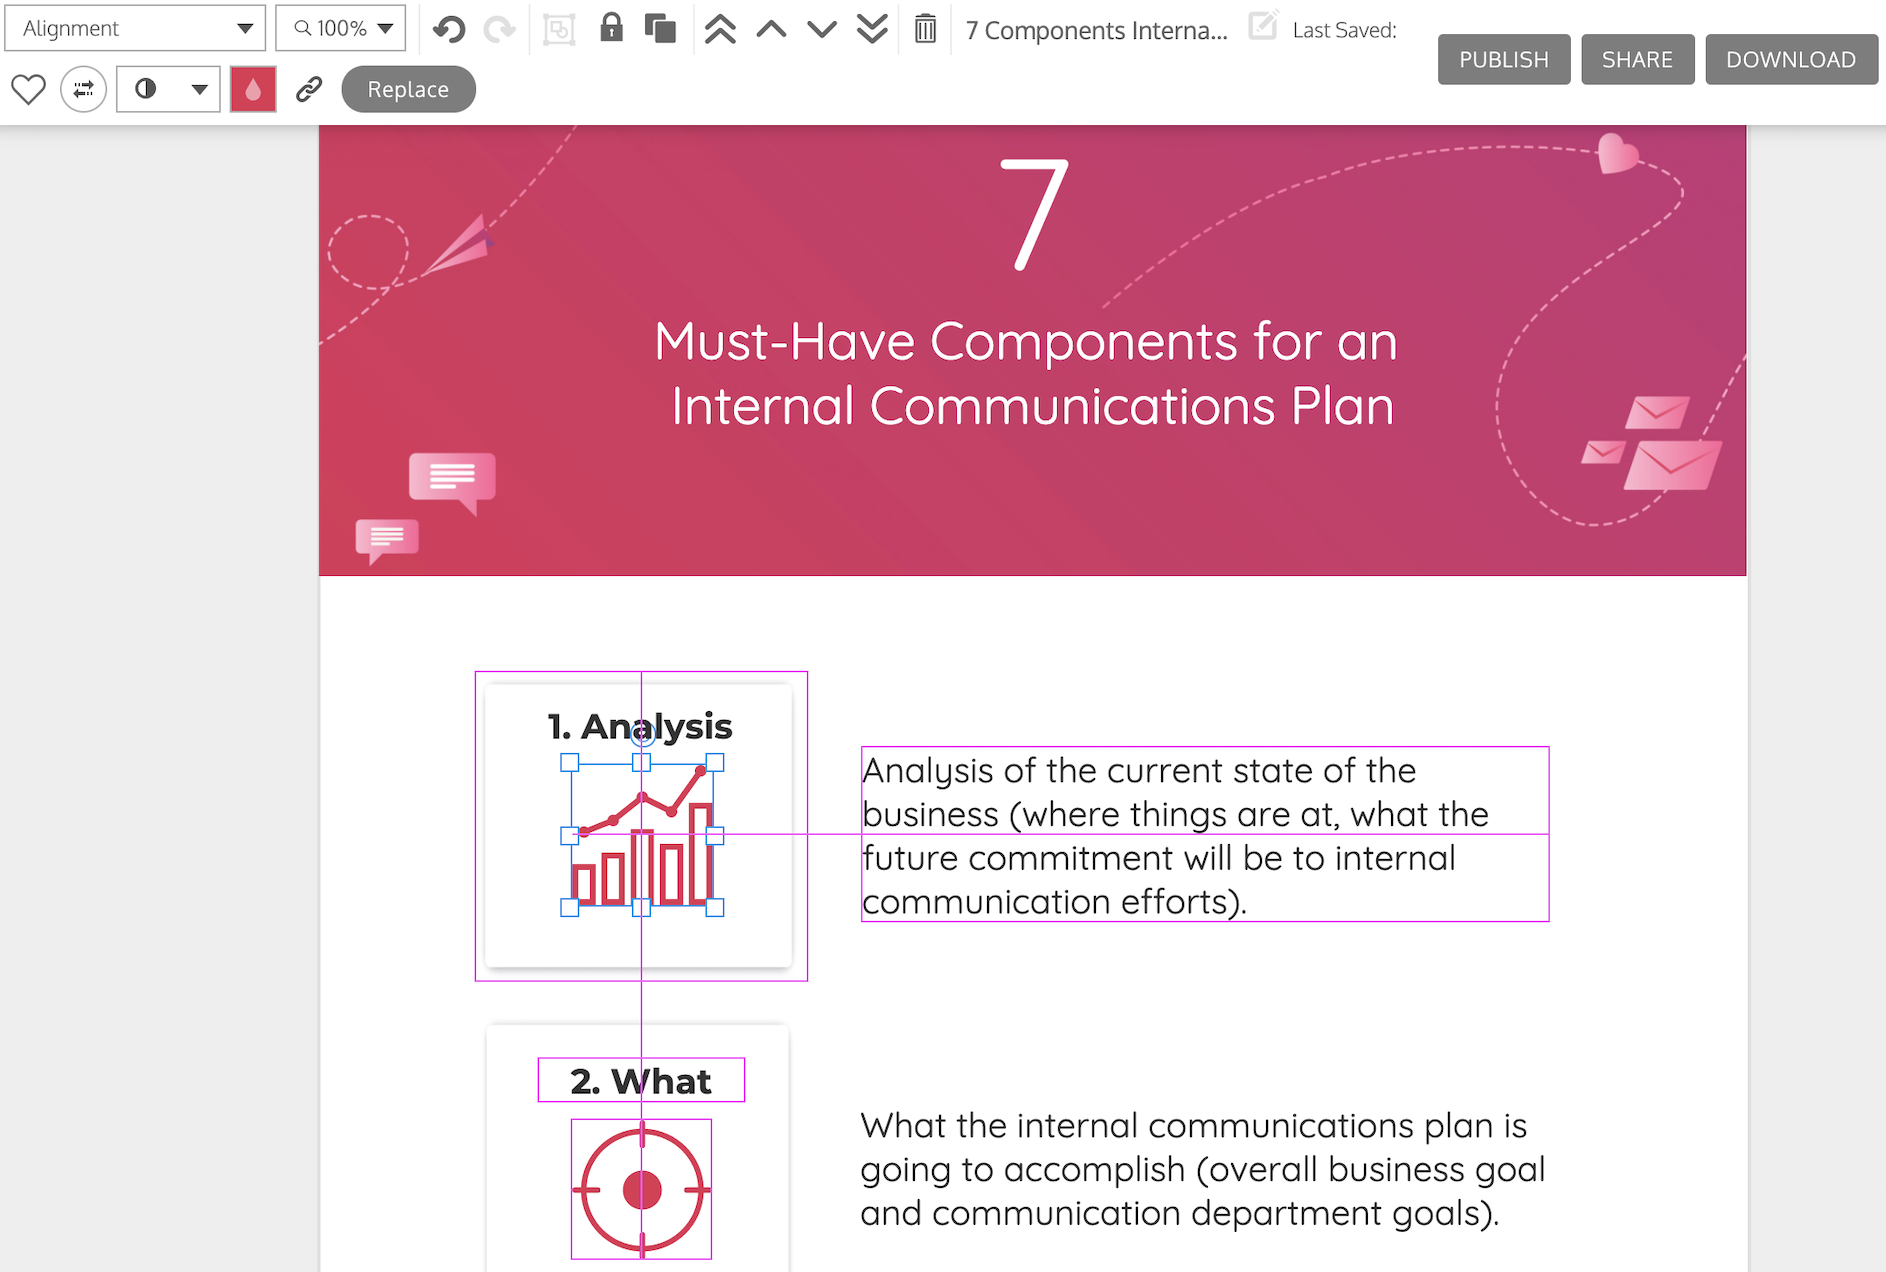
Venngage’s editor has a handy alignment tool that makes it easy to re-organize elements on the page. They also offer a grid view and page margins to help layout your designs for print.
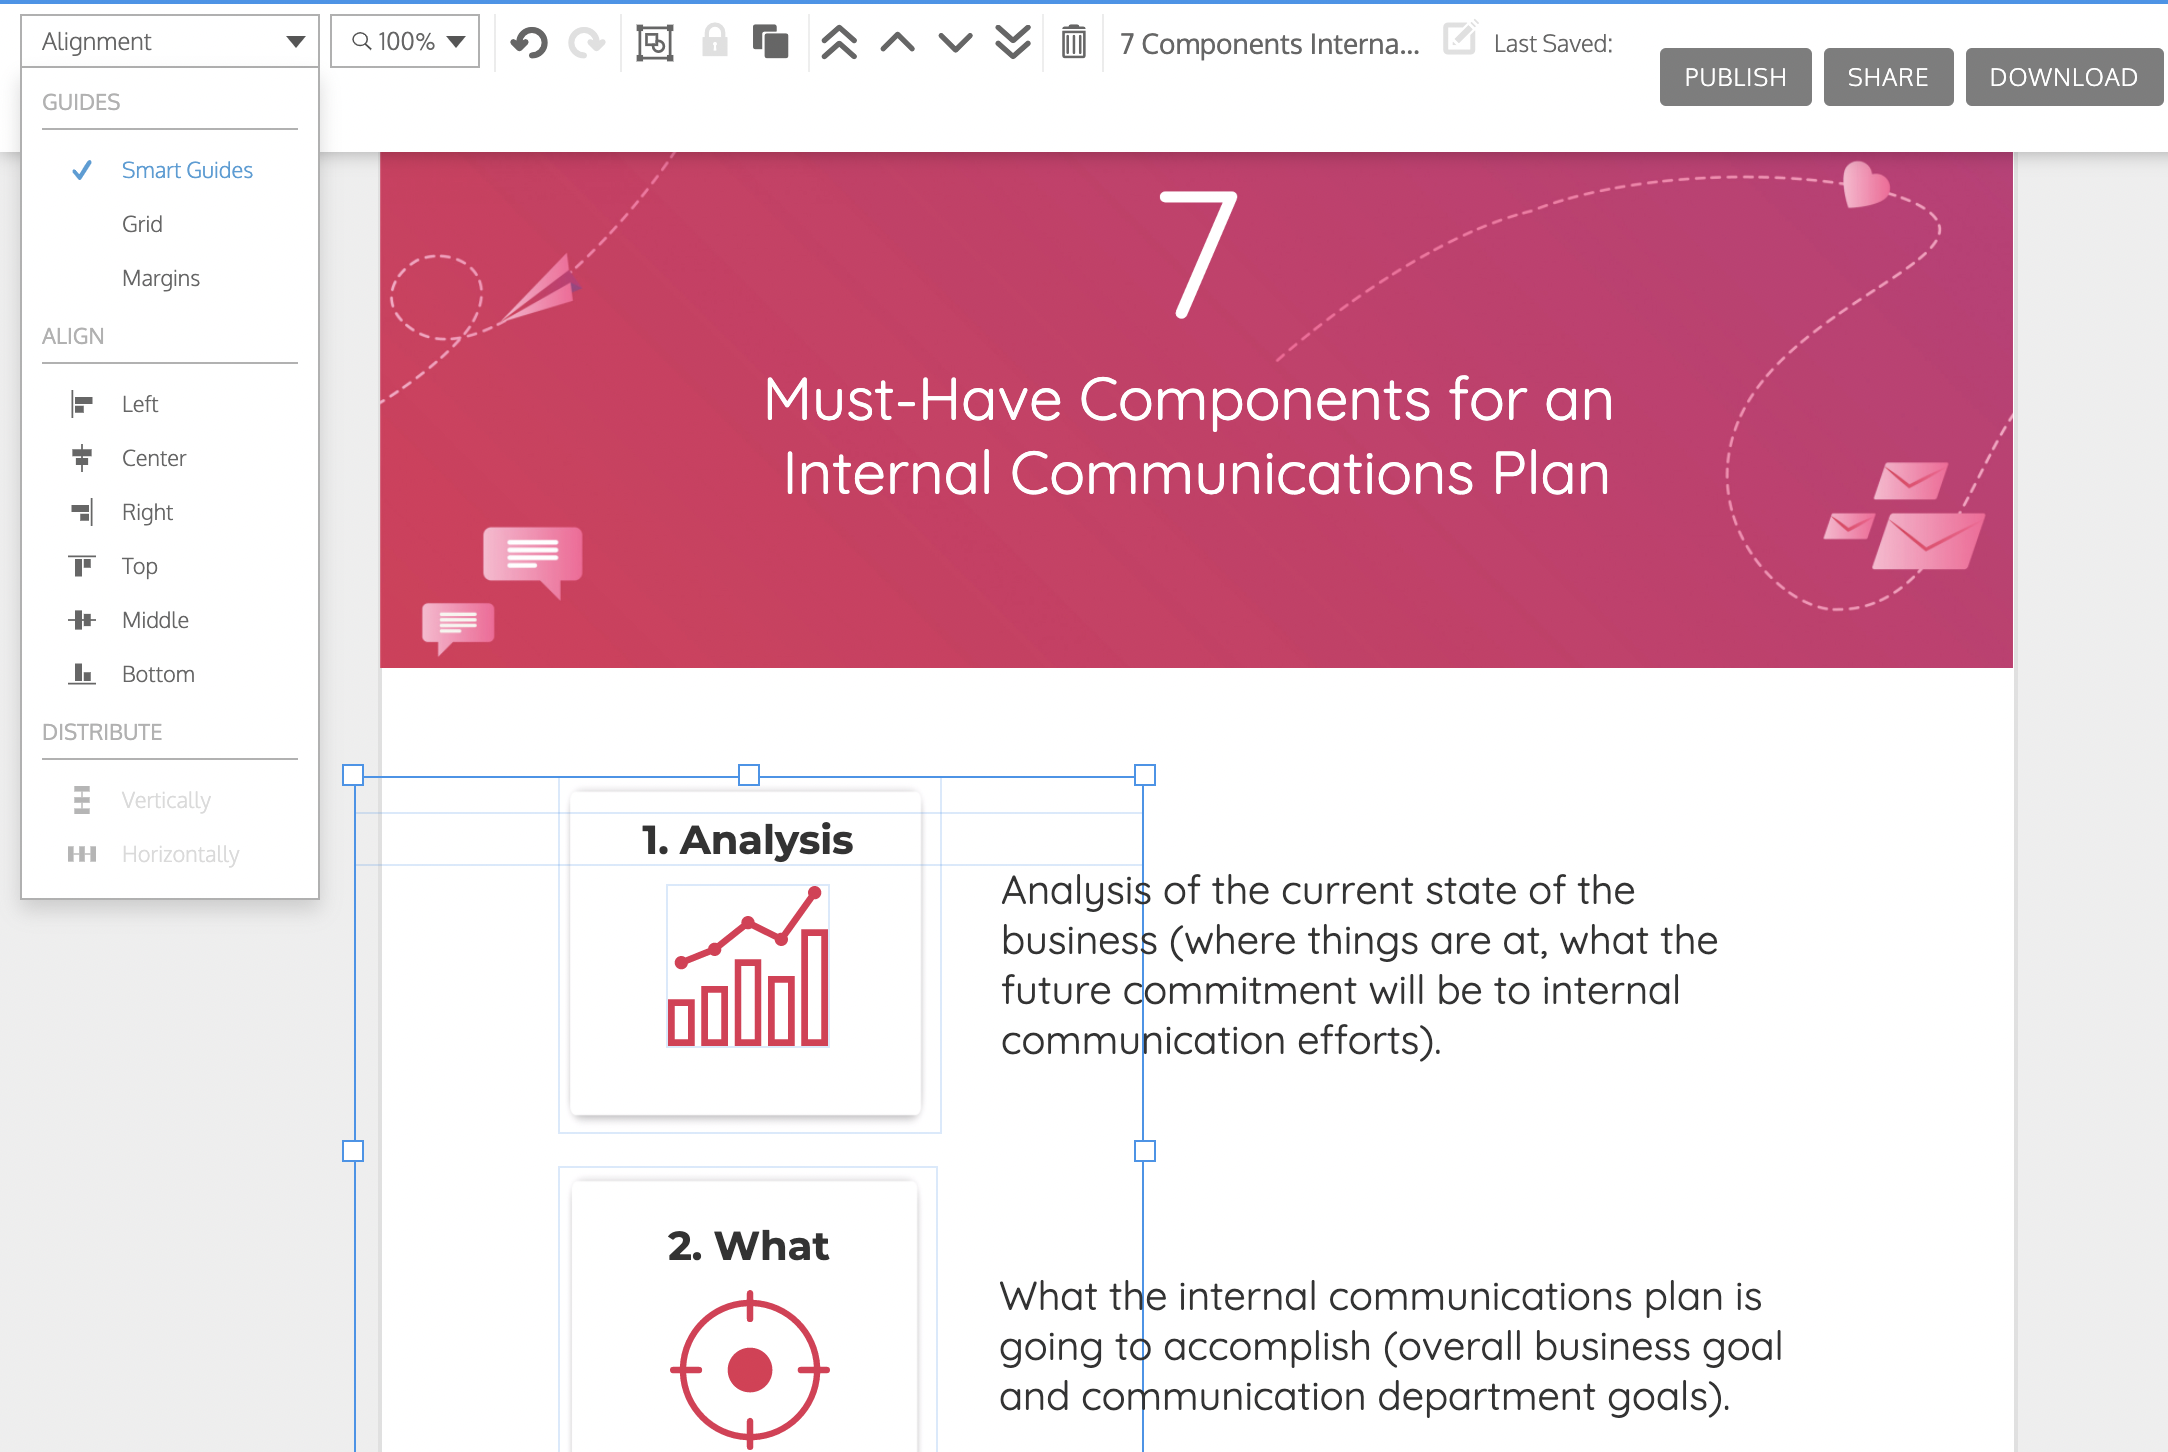
Venngage’s Smart Guides help you to align elements on your slides. These guides are particularly handy when creating infographic slides, since they tend to have a lot of points.
Exporting to PowerPoint
Many workplaces and schools require you to use PowerPoint for your presentations. But with Venngage, you don’t need to choose between the two. That’s because Venngage offers the option to export your presentation directly to PowerPoint.

You also have the option to export your slides as separate PNGs or to export your presentation in PDF and interactive PDF formats.
Adding your branding: PowerPoint vs. Venngage
Do you have visual brand guidelines that you need to follow? Then being able to easily apply your brand colors, fonts, and logos to your presentations can save you a lot of time. Let’s take a look at PowerPoint and Venngage branding features.
PowerPoint’s branding options
You can add your brand colors and fonts to your presentation in PowerPoint but it’s not the most seamless experience.
PowerPoint offers a selection of preset color palettes for you to choose from. You can pick and save your own color palettes to fit your brand guidelines.

However, PowerPoint does not offer you the option to paste hex codes. Instead, you will need to use the color wheel or use the color dropper tool to pull the color from your page.

You can upload your brand fonts to PowerPoint. However, if you send the presentation to someone who doesn’t have the font files on their computer, they won’t be able to see your brand fonts. This can make it difficult when sharing your presentation with people outside of your organization.
Venngage’s Brand Kit
Venngage also offers a Brand Kit that enables you to apply consistent branding to your designs in just a few clicks.
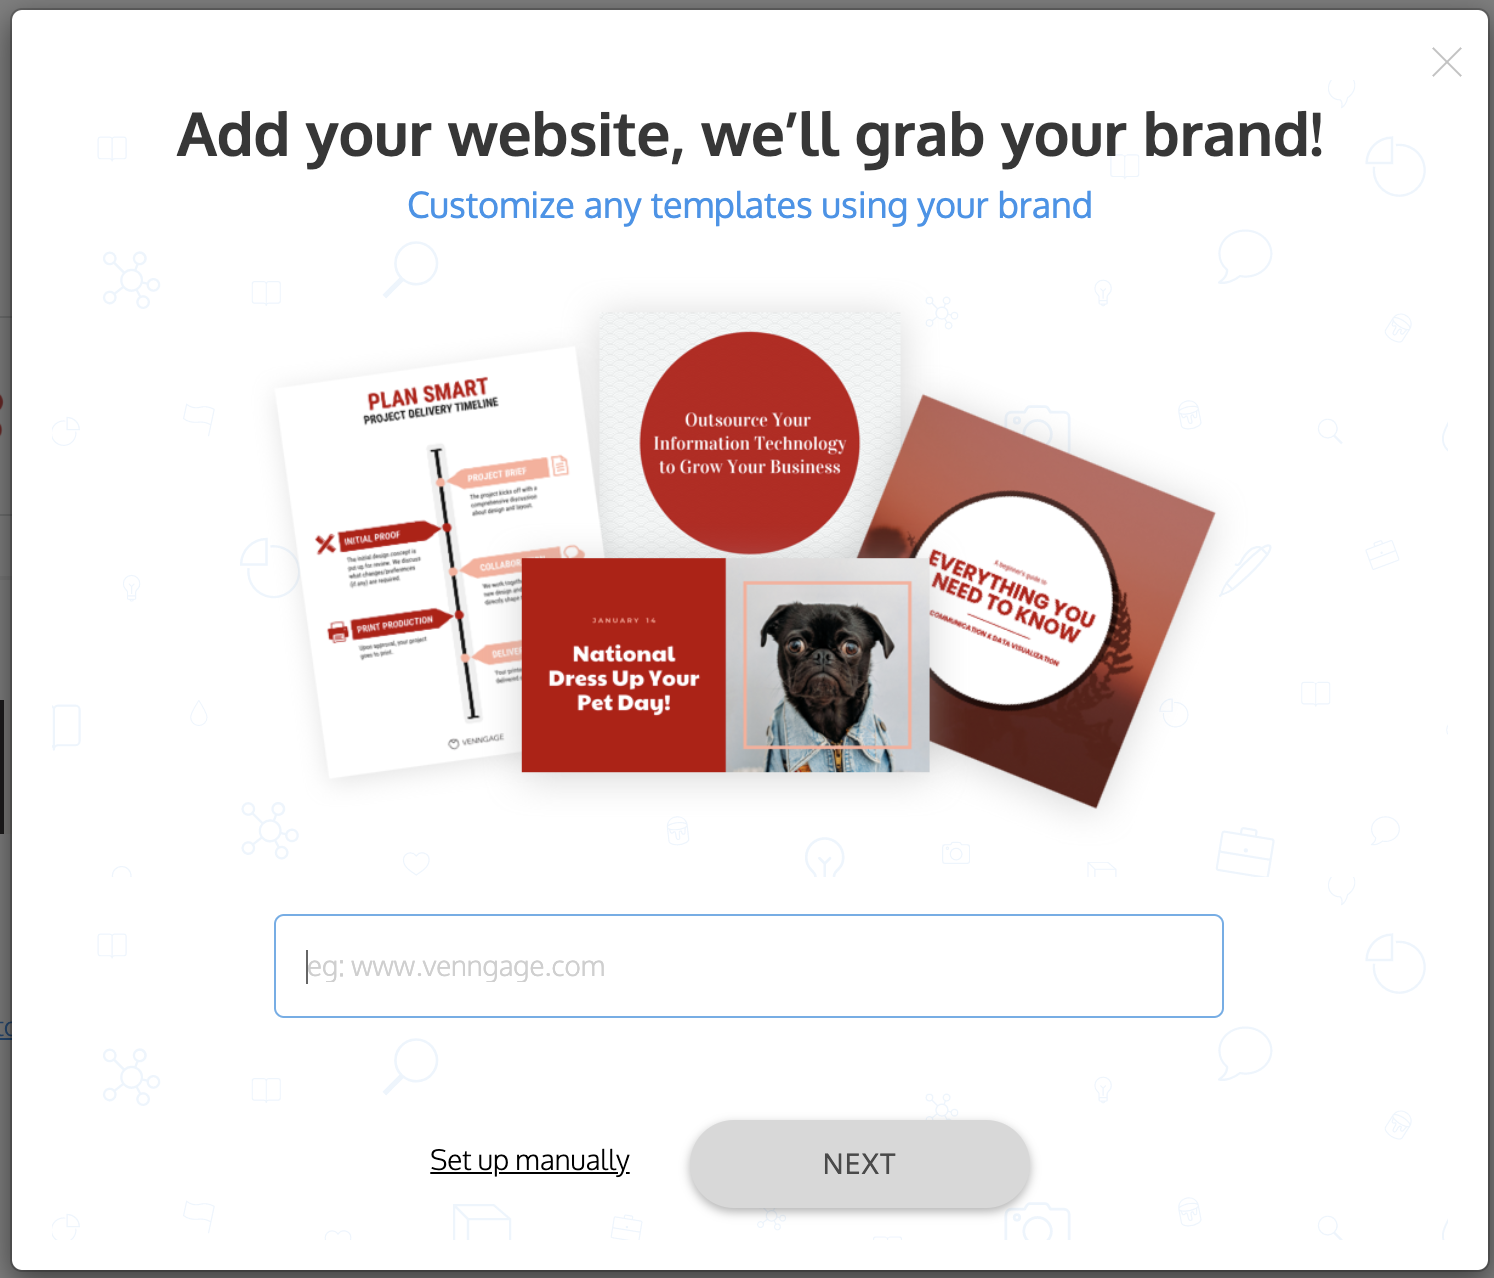
Simply paste your website URL and Venngage extracts the logo and website colors. Once you’re in the Brand Kit, you can upload your fonts and any other logos you want.
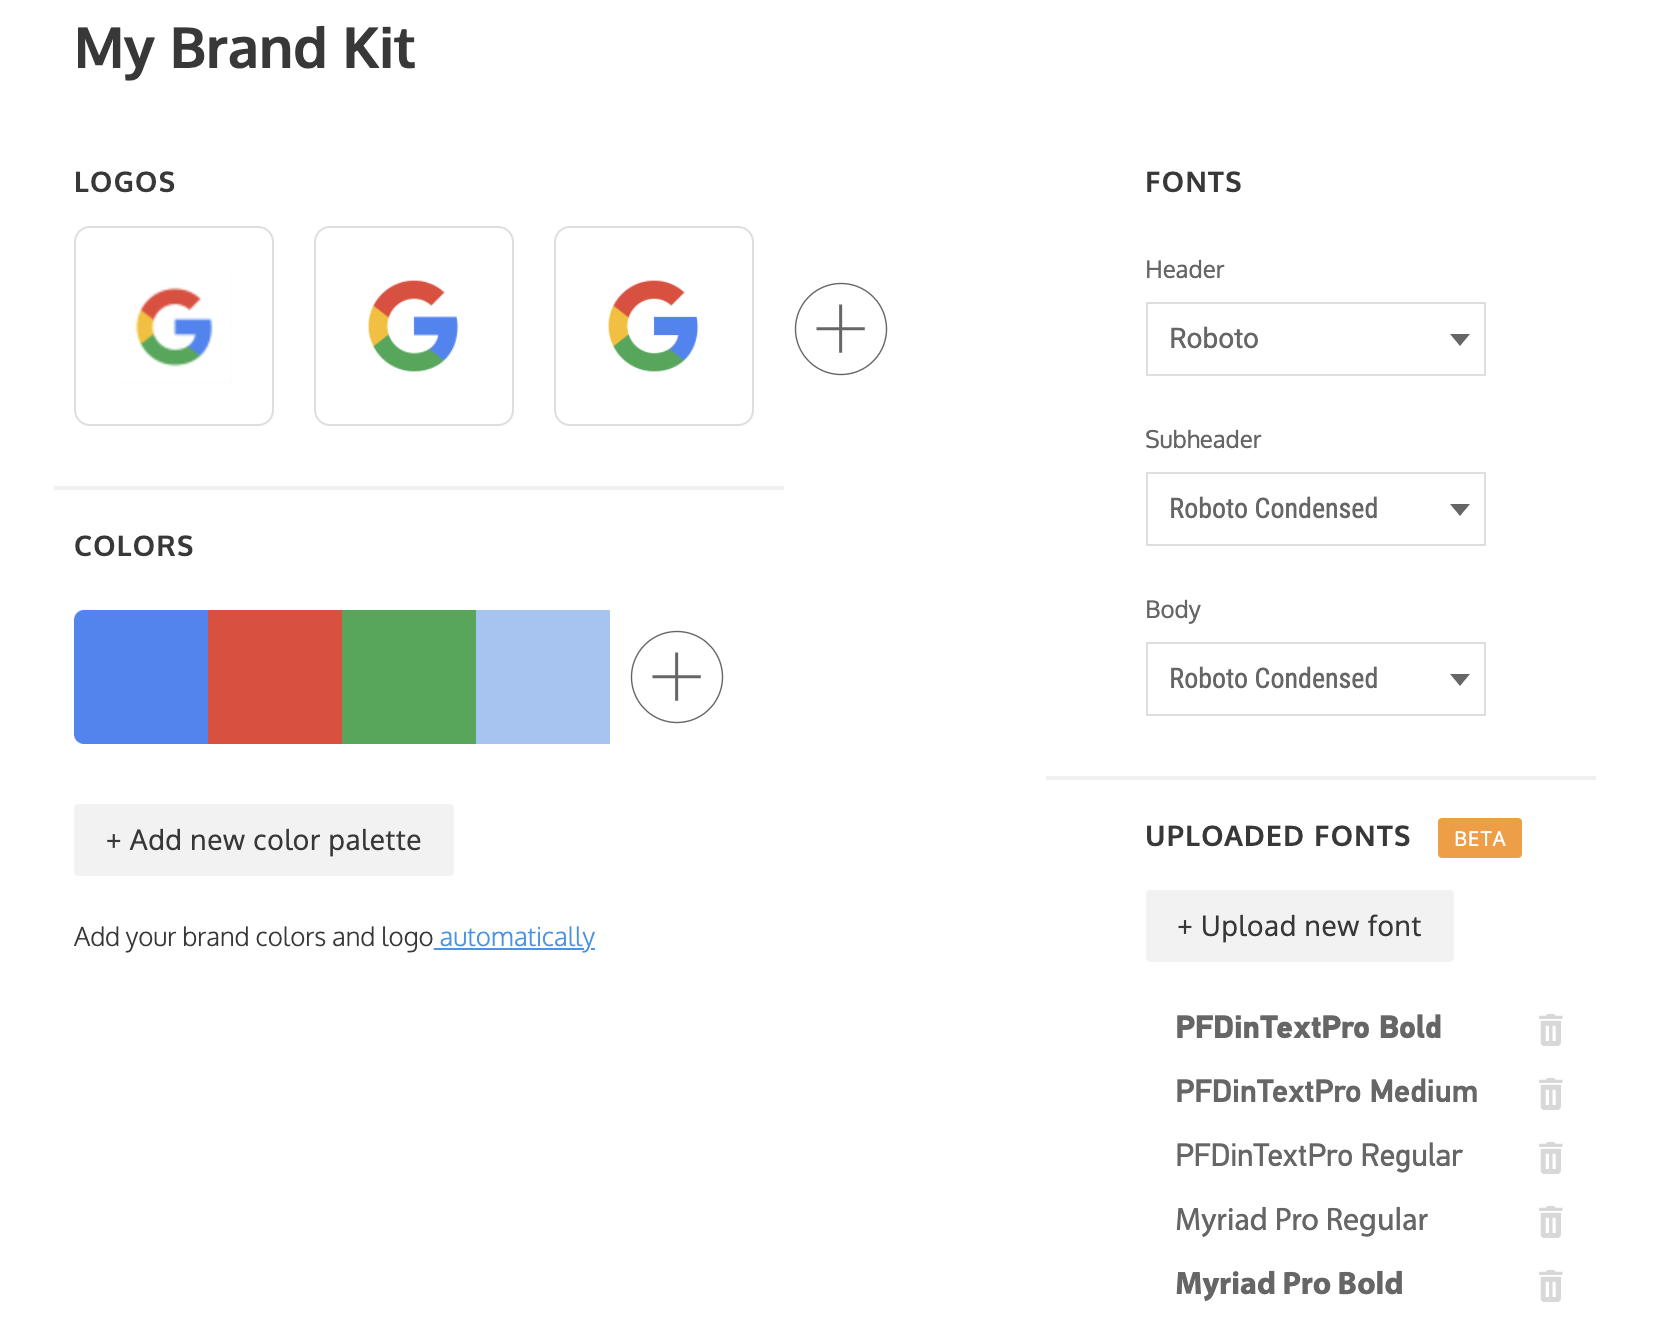
Once you’ve added your brand assets, you can apply them to any presentation template using the My Brand Kit tab on the side menu. You can also easily cycle through different color palette combinations using the color palette tool.
Support and resources: Venngage vs. Powerpoint
PowerPoint’s customer support
PowerPoint’s customer support has a 4.3 rating on Capterra and an 8.6 rating on G2.
There is no way to contact customer support from the PowerPoint editor. Instead, you will need to go back to the PowerPoint launch page and click on the Help button in the top menu. This opens a support article library where you can search for a topic you need help with.

Venngage’s customer support
Venngage’s Customer Support team is top-notch. Their customer service has a 4.6 rating on Capterra and a 9.4 rating on G2.
They offer live chat support, 24/7 as you can see in the demo below.

Venngage’s support team is very responsive—users can expect to receive a response well within 24 hours, usually within minutes. Support team members live all over the world, meaning there’s always someone in your time zone.
Venngage’s design resources
Because infographics are Venngage’s specialty, their resources are geared towards helping people succeed at infographic design. For example, with a Venngage for Business plan, you can schedule 1-1 design consultations with their in-house design experts.
Venngage also offers an extensive library of educational design resources (guides, webinars, and videos) that teach you the basics of infographic design, graphic design, information design, data visualization, and designing for accessibility. Their educational content is written and reviewed by their in-house information design experts.
Ease of use: PowerPoint vs. Venngage
How long does it take to become a PowerPoint pro?
Like with many of Microsoft’s apps, PowerPoint comes with a bit of a learning curve. It can take a while to learn how to use the different features, configure the menus, and integrate with their other apps.
Once you have learned the basics of using PowerPoint, it’s relatively easy to use. However, you are likely to start to run into limitations with their tool, particularly when creating infographics. The simple, cohesive style of their templates doesn’t lend much opportunity to be creative with your designs and their data visualization features are clunky to use.
If you’re looking for a basic presentation maker that integrates with Microsoft Office 365’s other apps, then PowerPoint will get the job done.
How long does it take to become a Venngage pro?
Venngage makes infographic design accessible to people of any design level. The intuitive editing features can significantly cut down on the time it would take to produce infographics, diagrams, and charts in a professional design solution like Illustrator.
If you’re new to visualizing data, it may take you a few tries to figure out which types of charts works best for your data, or which type of infographic will best visualize your process.
To help with the learning curve, Venngage offers a ton of helpful resources such as our YouTube channel and Learn Center. For example, this video breaks down for beginners how to pick the right chart.
The bottom line
Both PowerPoint and Venngage can be used to create a presentation in a pinch. Because PowerPoint integrates with the rest of Office365, it can be handy to use.
But if you’re looking to create engaging infographic slides that stand out from your average office presentation, Venngage gives you the flexibility and creative tools to do a lot more. Not only that but Venngage is also more intuitive for people who don’t have much design experience.
Venngage’s simple drag-and-drop canvas, wide selection of infographic templates, icons and illustrations, and chart editing features make them the design solution that better caters to creating professional, creative infographic presentations.


